September 10, 2025 a 03:31 am


CME: Dividend Analysis - CME Group Inc.
CME Group Inc. exhibits a strong dividend yield with a history of consistent dividend payments. Their commitment to returning value to shareholders is evident in their stable dividend growth and high payout ratios, although these warrant close monitoring in relation to earnings stability.
📊 Overview
The financial sector presents a robust opportunity through CME Group Inc., distinguished by a dividend yield of 4.09% and an impressive 23-year dividend history.
| Feature | Details |
|---|---|
| Sector | Financial |
| Dividend yield | 4.09% |
| Current dividend per share | $9.97 USD |
| Dividend history | 23 years |
| Last cut or suspension | None |
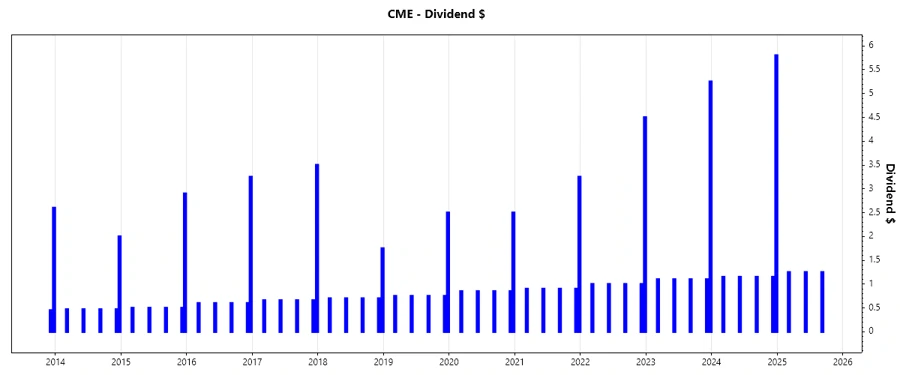
📈 Dividend History
The company's commitment to consistent dividend payments enhances investor confidence and underscores financial health.
| Year | Dividend per Share (USD) |
|---|---|
| 2025 | $3.75 |
| 2024 | $10.40 |
| 2023 | $9.65 |
| 2022 | $8.50 |
| 2021 | $6.85 |
📈 Dividend Growth
Tracking dividend growth is essential for investors seeking compounding potential from dividend income.
| Time | Growth |
|---|---|
| 3 years | 14.93% |
| 5 years | 13.59% |
The average dividend growth is 13.59% over 5 years. This shows moderate but steady dividend growth.
📉 Payout Ratio
The payout ratio is a critical metric, indicating how much of the profits are distributed as dividends, reflecting financial sustainability.
| Key Figure | Ratio |
|---|---|
| EPS-based | 95.50% |
| Free cash flow-based | 87.50% |
The high EPS payout ratio of 95.50% suggests that nearly all profits are returned to shareholders. The FCF ratio of 87.50% underlines a sustainable payout strategy.
🗣️ Cashflow & Capital Efficiency
Assessing cash flow yields and capital efficiency metrics gives insight into operational efficiency and fiscal health.
| Metric | 2024 | 2023 | 2022 |
|---|---|---|---|
| Free Cash Flow Yield | 4.31% | 4.47% | 4.92% |
| Earnings Yield | 4.22% | 4.27% | 4.46% |
| CAPEX to Operating Cash Flow | 2.11% | 2.21% | 2.94% |
| Stock-based Compensation to Revenue | 1.46% | 1.49% | 1.68% |
| Free Cash Flow / Operating Cash Flow Ratio | 97.45% | 97.79% | 97.06% |
| Return on Invested Capital | 8.51% | 7.34% | 6.37% |
The cash flow figures indicate robust operational cash generation with effective capital deployment. The company maintains a healthy cash conversion cycle, reflecting efficiency and flexibility in operations.
⚠️ Balance Sheet & Leverage Analysis
Balance sheet leverage ratios highlight credit risk, liquidity stance, and long-term solvency.
| Metric | 2024 | 2023 | 2022 |
|---|---|---|---|
| Debt-to-Equity | 12.94% | 14.53% | 12.86% |
| Debt-to-Assets | 2.49% | 2.99% | 1.97% |
| Debt-to-Capital | 11.46% | 12.68% | 11.39% |
| Net Debt to EBITDA | 0.11 | 0.21 | 0.18 |
| Current Ratio | 1.02 | 1.02 | 1.01 |
| Quick Ratio | 1.01 | 1.02 | 0.03 |
| Financial Leverage | 5.19 | 4.85 | 6.51 |
The stability of CME Group Inc.'s balance sheet is illustrated by its low leverage ratios, indicating prudent debt management and strong liquidity positioning.
🗯️ Fundamental Strength & Profitability
Profit metrics and return ratios provide insight into the company's core operational performance and efficiency.
| Metric | 2024 | 2023 | 2022 |
|---|---|---|---|
| Return on Equity | 13.31% | 12.07% | 10.06% |
| Return on Assets | 2.57% | 2.49% | 1.54% |
| Net Margin | 57.52% | 57.83% | 53.61% |
| EBIT Margin | 76.71% | 77.31% | 72.78% |
| EBITDA Margin | 82.20% | 83.63% | 80.01% |
| Gross Margin | 86.13% | 85.15% | 84.99% |
| Research & Development to Revenue | 0% | 0% | 0% |
With robust ROE and margins, CME Group Inc. demonstrates a strong profitability profile, paving the way for sustainable growth and shareholder returns.
📉 Price Development
🌟 Dividend Scoring System
| Category | Score | Score Bar |
|---|---|---|
| Dividend yield | 5 | |
| Dividend Stability | 5 | |
| Dividend growth | 4 | |
| Payout ratio | 3 | |
| Financial stability | 4 | |
| Dividend continuity | 5 | |
| Cashflow Coverage | 4 | |
| Balance Sheet Quality | 4 |
Total Score: 34/40
✅ Rating
Based on a comprehensive analysis of CME Group Inc.'s dividend profile, the company's commitment to maintaining robust dividend payments alongside steady growth and financial stability positions it as a strong candidate for income-focused investors. The firm's consistent management of payout ratios amidst strong financial fundamentals supports a favorable investment thesis for long-term holdings.
Smart Data Insight
Master the Perfect Entry & Exit for this Stock
Don't leave your profits to chance. Historically, this stock follows specific seasonal patterns that institutional traders use to maximize returns.
- ✅ Identify the "Golden Buying Window"
- ✅ Avoid high-risk correction cycles
- ✅ Backtested data from the last 20+ years