August 30, 2025 a 07:46 am

CME: Dividend Analysis - CME Group Inc.
CME Group Inc. has a robust dividend profile rooted in decades of consistency. With a current market capitalization of over $96 billion, the company's dividend yield stands at an impressive 4.01%, supported by a history of 23 years without significant cuts or suspensions. These metrics suggest a reliable dividend investment in the finance sector.
📊 Overview
CME Group Inc., a pivotal player in the finance sector, showcases a stable dividend yield with strong historical backing. The continuous dividend commitment underpins its reputation.
| Metric | Details |
|---|---|
| Sector | Finance |
| Dividend yield | 4.01 % |
| Current dividend per share | 9.97 USD |
| Dividend history | 23 years |
| Last cut or suspension | None |
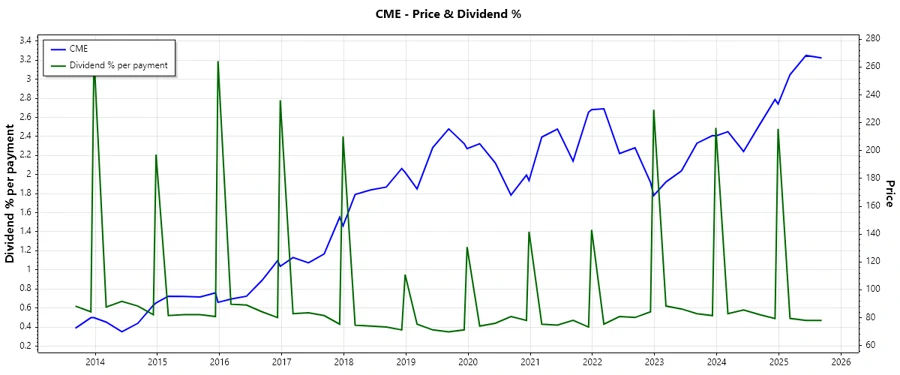
📈 Dividend History
The dividend history of CME Group Inc. is a testament to its stability and growth potential. Such a history is critical for investors seeking reliable income streams.
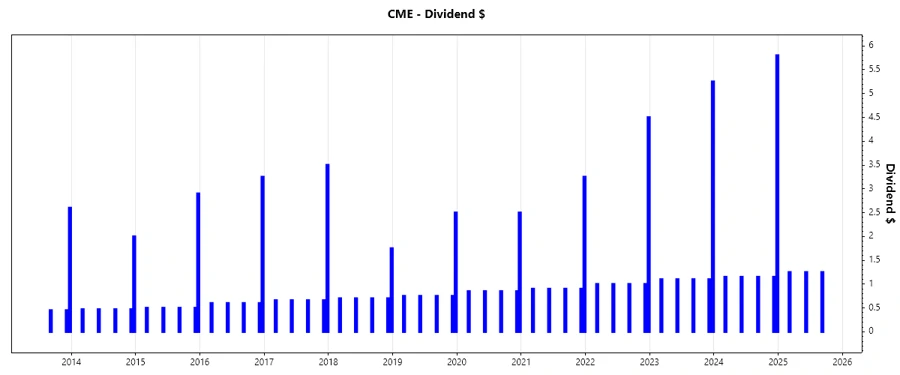
| Year | Dividend per Share (USD) |
|---|---|
| 2025 | 3.75 |
| 2024 | 10.40 |
| 2023 | 9.65 |
| 2022 | 8.5 |
| 2021 | 6.85 |
📊 Dividend Growth
Analyzing dividend growth is vital as it indicates a company's ability to enhance shareholder value over time. CME Group has exhibited consistent growth, reinforcing investor confidence.
| Time | Growth |
|---|---|
| 3 years | 14.93 % |
| 5 years | 13.59 % |
The average dividend growth is 13.59% over 5 years. This shows moderate but steady dividend growth.
📊 Payout Ratio
Payout ratios help gauge a firm's ability to sustain dividend payments. CME displays a balanced approach towards earnings and free cash flow.
| Key figure | Ratio |
|---|---|
| EPS-based | 95.50 % |
| Free cash flow-based | 87.50 % |
The high EPS payout ratio of 95.50% suggests that CME is returning almost all its earnings to shareholders. Meanwhile, the FCF payout ratio of 87.50% indicates strong cash flow management.
📊 Cashflow & Capital Efficiency
Assessing cash flow health and capital efficiency reveals how well a company can fund operations and investments. CME’s metrics reflect robust operational management.
| Year | 2024 | 2023 | 2022 |
|---|---|---|---|
| Free Cash Flow Yield | 4.31% | 4.47% | 4.92% |
| Earnings Yield | 4.22% | 4.27% | 4.46% |
| CAPEX to Operating Cash Flow | 2.15% | 2.21% | 2.93% |
| Stock-based Compensation to Revenue | 1.46% | 1.49% | 1.68% |
| Free Cash Flow / Operating Cash Flow Ratio | 97.45% | 97.79% | 97.06% |
These figures underscore CME's capability to efficiently manage its cash flows and investments, promoting long-term capital sustainability.
📊 Balance Sheet & Leverage Analysis
A strong balance sheet with low leverage is vital for long-term financial stability. CME maintains a conservative leverage profile, pivotal for prolonged operational health.
| Year | 2024 | 2023 | 2022 |
|---|---|---|---|
| Debt-to-Equity | 12.94% | 14.53% | 12.86% |
| Debt-to-Assets | 2.49% | 2.99% | 1.97% |
| Debt-to-Capital | 11.46% | 12.68% | 11.39% |
| Net Debt to EBITDA | 10.63% | 20.83% | 17.89% |
| Current Ratio | 1.02 | 1.02 | 1.01 |
| Quick Ratio | 1.01 | 1.02 | 1.03 |
| Financial Leverage | 5.19 | 4.85 | 6.51 |
CME’s balance sheet strength and liquidity suggest a stable financial position with moderate leverage, underscoring prudent financial management.
📊 Fundamental Strength & Profitability
Strong fundamental health and profitability metrics are essential for long-term growth. CME’s operational efficiency and its ability to generate profits are apparent through these ratios.
| Year | 2024 | 2023 | 2022 |
|---|---|---|---|
| Return on Equity | 13.31% | 12.07% | 10.06% |
| Return on Assets | 2.57% | 2.49% | 1.54% |
| ROIC | 8.51% | 7.34% | 6.37% |
| Net Margin | 57.52% | 57.83% | 53.61% |
| Gross Margin | 86.13% | 85.15% | 84.99% |
| EBIT Margin | 76.71% | 77.31% | 72.78% |
| EBITDA Margin | 82.20% | 83.63% | 80.00% |
| R&D to Revenue | 0.00% | 0.00% | 0.00% |
These profitability metrics illustrate CME’s efficient resource utilization, fostering high returns and strong margins, which are crucial for sustainable growth.
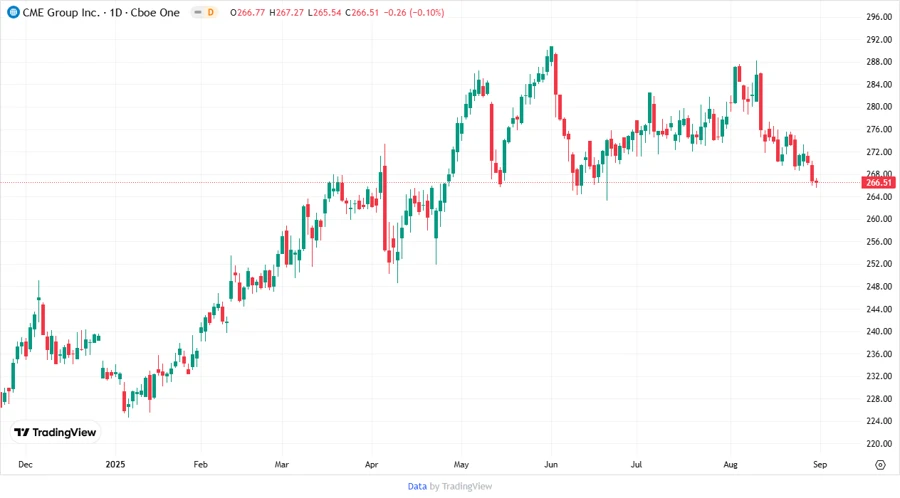
📈 Price Development
🗣️ Dividend Scoring System
| Criteria | Score | Score Bar |
|---|---|---|
| Dividend yield | 4 | |
| Dividend Stability | 5 | |
| Dividend growth | 4 | |
| Payout ratio | 3 | |
| Financial stability | 5 | |
| Dividend continuity | 5 | |
| Cashflow Coverage | 4 | |
| Balance Sheet Quality | 5 |
Total Score: 35/40
✅ Rating
In conclusion, CME Group Inc. showcases a stellar dividend profile marked by stability, growth potential, and financial robustness. With a strong balance sheet and consistent payout history, it represents a favorable opportunity for income-focused investors. The current assessment reflects a compelling case for including CME in a diversified dividend portfolio.