June 07, 2025 a 03:31 am


CME: Dividend Analysis - CME Group Inc.
CME Group Inc. stands as a pivotal player in the financial sector, offering an attractive dividend yield coupled with a commendable history of consistent dividend payments spanning over two decades. The company's approach to dividends showcases a strategic balance between rewarding shareholders and sustaining growth. Despite occasional variances, the overall trajectory of dividend growth remains robust, underscoring CME Group's commitment to shareholder value.
📊 Overview
| Metric | Details |
|---|---|
| Sector | Financial |
| Dividend Yield | 3.87% |
| Current Dividend per Share | $9.97 |
| Dividend History | 23 years |
| Last Cut or Suspension | None |
🗣️ Dividend History
An impressive dividend history is vital for evaluating the long-term reliability of income from an investment. CME Group's remarkable 23-year dividend history reflects financial strength and a commitment to returning value to shareholders.
| Year | Dividend per Share (USD) |
|---|---|
| 2025 | 2.50 |
| 2024 | 10.40 |
| 2023 | 9.65 |
| 2022 | 8.50 |
| 2021 | 6.85 |
📈 Dividend Growth
Dividend growth metrics are crucial for assessing the potential increase in future income from an investment. A consistent growth rate, as showcased by CME Group, implies strong financial health and potential for future increase in shareholder returns.
| Time | Growth |
|---|---|
| 3 years | 14.93% |
| 5 years | 13.59% |
The average dividend growth is 13.59% over 5 years. This shows moderate but steady dividend growth.
💹 Payout Ratio
Understanding payout ratios helps in determining the sustainability of a company's dividend payments. CME Group's high payout ratios suggest a considerable portion of earnings and cash flows are allocated to dividends.
| Key Figure | Ratio |
|---|---|
| EPS-based | 99.81% |
| Free Cash Flow-based | 93.58% |
CME Group's 99.81% EPS payout ratio and 93.58% FCF payout ratio highlight a commitment to high dividend payments, though future sustainability could be influenced under varying market conditions.
🚀 Cashflow & Capital Efficiency
Robust cash flow metrics are a cornerstone for funding dividends and capital investments. Evaluating these metrics provides insights into a company's operational efficiency and capital allocation strategies.
| Year | 2024 | 2023 | 2022 |
|---|---|---|---|
| Free Cash Flow Yield | 4.31% | 4.47% | 4.92% |
| Earnings Yield | 4.22% | 4.27% | 4.46% |
| CAPEX/Operating Cash Flow | - | 2.21% | 2.94% |
| Stock-based Compensation/Revenue | 1.46% | 1.49% | 1.68% |
| Free Cash Flow/Operating Cash Flow Ratio | 97.45% | 97.79% | 97.06% |
The cash flow stability and capital efficiency of CME Group reflect a well-managed financial structure, reinforcing its capability to sustain dividend payouts effectively.
⚖️ Balance Sheet & Leverage Analysis
A comprehensive balance sheet analysis reveals the financial health and leverage levels critical for long-term stability. CME Group maintains low leverage, indicative of prudent financial management.
| Year | 2024 | 2023 | 2022 |
|---|---|---|---|
| Debt-to-Equity | 12.94% | 14.53% | 12.79% |
| Debt-to-Assets | 2.49% | 2.99% | 1.97% |
| Debt-to-Capital | 11.46% | 12.68% | 11.34% |
| Net Debt to EBITDA | 0.12 | 0.26 | 0.21 |
| Current Ratio | 1.01 | 1.02 | 1.01 |
| Quick Ratio | 1.01 | 1.02 | 0.03 |
| Financial Leverage | 5.19 | 4.85 | 6.48 |
The leverage analysis frames CME Group as maintaining a robust and stable financial position, ensuring resilience and sustainability of its dividend policy.
📉 Fundamental Strength & Profitability
Metrics of profitability and fundamental strength are vital for assessing the operational success and overall value proposition of the company. CME Group exhibits solid returns and margins, fundamental to maintaining competitive advantage.
| Year | 2024 | 2023 | 2022 |
|---|---|---|---|
| Net Profit Margin | 57.52% | 57.83% | 53.61% |
| Gross Profit Margin | 86.13% | 85.15% | 84.99% |
| EBIT Margin | 76.71% | 77.31% | 72.78% |
| EBITDA Margin | 75.24% | 67.90% | 67.05% |
| Research & Development/Revenue | - | 3.92% | 3.75% |
CME Group's profitability ratios, reflecting high margins and returns, signify a well-fortified financial standing capable of sustaining shareholder payouts.
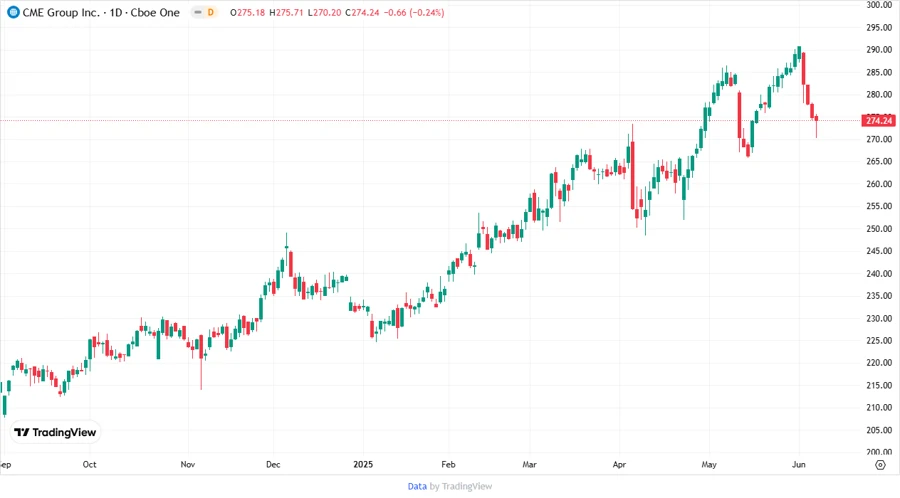
📈 Price Development
✅ Dividend Scoring System
| Criterion | Score | Score Bar |
|---|---|---|
| Dividend Yield | 4 | |
| Dividend Stability | 5 | |
| Dividend Growth | 4 | |
| Payout Ratio | 3 | |
| Financial Stability | 5 | |
| Dividend Continuity | 5 | |
| Cashflow Coverage | 4 | |
| Balance Sheet Quality | 4 |
Overall Score: 34/40
🌟 Rating
CME Group Inc. demonstrates a comprehensive financial strategy centered on consistent dividend payouts and robust financial stability. The balance of aggressive dividend yields and strong balance sheet leverages underscores the company as an exemplary choice for income-focused investors. With an overall score of 34 out of 40, CME Group stands out as a reliable and rewarding investment in the current market landscape.
Smart Data Insight
Master the Perfect Entry & Exit for this Stock
Don't leave your profits to chance. Historically, this stock follows specific seasonal patterns that institutional traders use to maximize returns.
- ✅ Identify the "Golden Buying Window"
- ✅ Avoid high-risk correction cycles
- ✅ Backtested data from the last 20+ years