
June 08, 2026 a 08:15 am

CMCSA: Trend and Support & Resistance Analysis - Comcast Corporation
The Comcast Corporation stock (CMCSA) reflects a comprehensive involvement in media and technology. With recent fluctuations and evolving trends, the stock has shown both potential and volatility. Given its diverse segment portfolio, from cable communications to theme parks, it represents a key player in the industry. Analysts are watching closely for signs of stabilization or further trend shifts in response to market dynamics.
Trend Analysis
| Date | Closing Price | Trend |
|---|---|---|
| 2026-06-05 | 23.82 | ▼ Reducing |
| 2026-06-04 | 23.33 | ▼ Reducing |
| 2026-06-03 | 23.52 | ▼ Reducing |
| 2026-06-02 | 24.85 | ▲ Increasing |
| 2026-06-01 | 25.05 | ▲ Increasing |
| 2026-05-29 | 24.87 | ▼ Reducing |
| 2026-05-28 | 25.16 | ▲ Increasing |
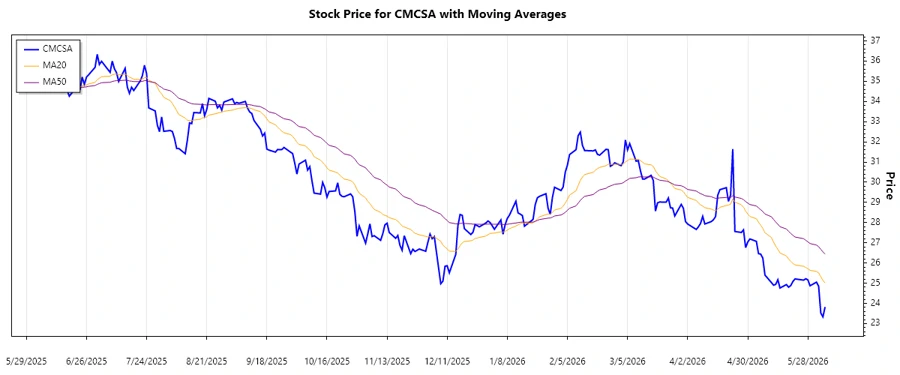
The analysis indicates a predominant short-term downtrend despite occasional upward shifts. The EMA20 remains below the EMA50, reinforcing the bearish momentum. This suggests continued caution for investors.
Support and Resistance
| Zone Type | Range | Direction |
|---|---|---|
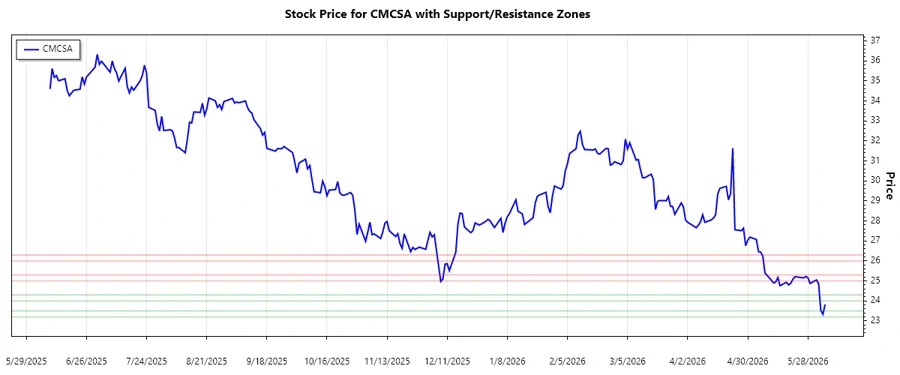
| Support 1 | 23.20 - 23.50 | ↘️ Potential Breakdown |
| Support 2 | 24.00 - 24.30 | ↗️ Holding |
| Resistance 1 | 25.00 - 25.30 | ↗️ Testing |
| Resistance 2 | 26.00 - 26.30 | ↗️ Testing |
The stock is currently navigating within its defined support zones. As prices approach these levels, they will signal critical areas for potential reversal or continuation of the current trend.
Conclusion
The Comcast Corporation stock currently exhibits a bearish trend with potential volatility in the coming weeks. Investors need to be wary of critical support zones which could either provide a bounce or signal further downside potential. The inherent risks are balanced by possible rewards if the trend reverses. Continuous monitoring is crucial for future strategy adjustments, evaluating both short-term technical factors and broader market conditions affecting the media and technology sectors.
json This analysis outlines the technical situation for Comcast Corporation's stock, focusing on recent trends and key price zones, useful for ongoing investment evaluation.
Smart Data Insight
Master the Perfect Entry & Exit for this Stock
Don't leave your profits to chance. Historically, this stock follows specific seasonal patterns that institutional traders use to maximize returns.
- ✅ Identify the "Golden Buying Window"
- ✅ Avoid high-risk correction cycles
- ✅ Backtested data from the last 20+ years