November 11, 2025 a 04:45 pm

CMCSA: Fibonacci Analysis - Comcast Corporation
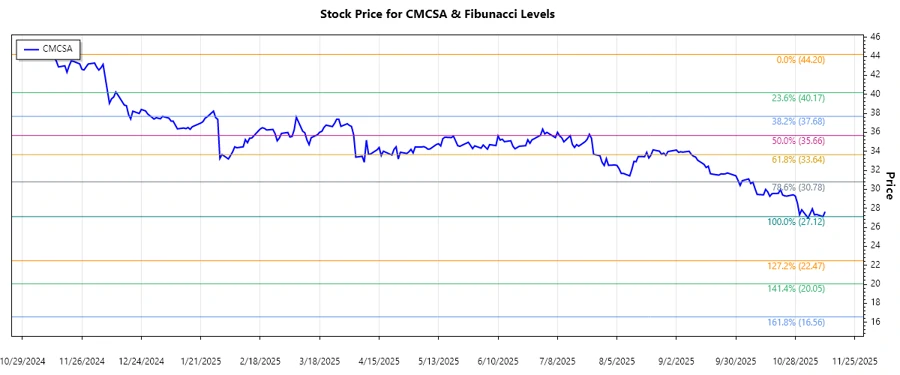
Comcast Corporation has faced a significant downtrend from November 2024 to November 2025. The stock has seen a decline in its price level from above $40 to under $28. Technical indicators suggest that the stock might have hit a short-term bottom, within a retracement period. Analysts should watch for a potential reversal or consolidation near current levels.
Fibonacci Analysis
| Analysis Detail | Data |
|---|---|
| Trend Start Date | 2024-11-11 |
| Trend End Date | 2025-11-11 |
| High Price | $44.20 (2024-11-11) |
| Low Price | $27.12 (2025-11-10) |
| Fibonacci Level | Price |
|---|---|
| 0.236 | $31.8772 |
| 0.382 | $34.3152 |
| 0.5 | $35.66 |
| 0.618 | $37.0048 |
| 0.786 | $39.4092 |
The current price of $27.64 is below the 0.236 Fibonacci retracement level, indicating that the stock is potentially in a retracement zone. Currently, it's finding support near the recent lows. This suggests possible support levels, and a break above the nearest Fibonacci level could indicate emerging bullish momentum.
Conclusion
Comcast Corporation's stock is experiencing a critical phase. With a significant downtrend over a year, its price movement is essential for short-term technical positioning. The current levels suggest potential support, and a break beyond the key Fibonacci levels could indicate bullish implications. Investors should, however, be cautious of broader market conditions and technological shifts that might disrupt traditional media channels. Media innovations, market competition, and regulatory compliance pose challenges, while advances in broadband and streaming services offer new growth opportunities.