August 25, 2025 a 06:45 am

CMCSA: Fibonacci Analysis - Comcast Corporation
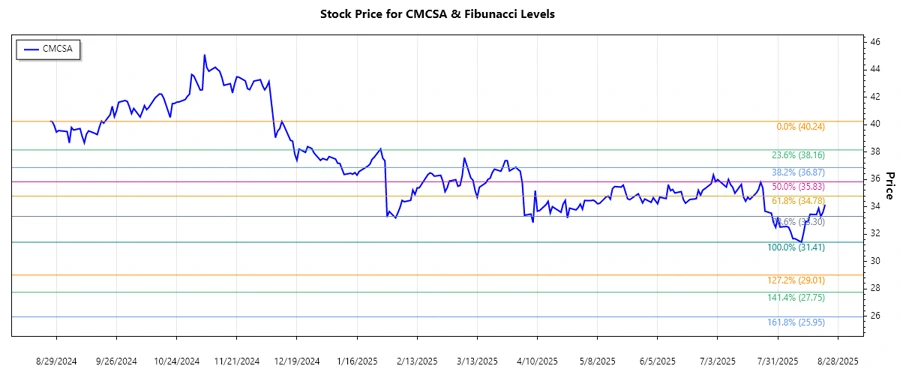
Comcast Corporation has seen a varied trend over the recent months. Despite involvement in diverse segments ranging from media to technology, its share price movement reflects broader market sentiments alongside sector-specific challenges. Recent data suggests a slight decline, but historical resilience and business diversification offer potential recovery. Investors should monitor key support levels and potential upside catalyzed through media innovations and streaming growth.
Fibonacci Analysis
| Information | Details |
|---|---|
| Analyzed Trend | Downtrend |
| Start Date | 2024-12-12 |
| End Date | 2025-08-22 |
| High Point | $40.24 on 2024-12-12 |
| Low Point | $31.41 on 2025-08-11 |
| Fibonacci Levels |
|
| Current Price | $34.15 |
| Retracement Zone | 0.382 |
| Technical Interpretation | The current price suggests the stock is within the 0.382 retracement level, indicating a potential resistance level if the price does not break above. |
Conclusion
Comcast Corporation's stock has experienced a sustained downward trend lately, possibly due to broader market pressures and sector-specific challenges. The identified Fibonacci levels indicate critical support and resistance thresholds that investors should consider. The 0.382 retracement level suggests a significant resistance point; if surpassed, the subsequent level of interest would be at 0.5. Market developments, particularly in streaming and broadband, could influence a shift in momentum. However, investors need to remain cautious about potential market volatility and sectoral shifts, especially in the media landscape.
Smart Data Insight
Master the Perfect Entry & Exit for this Stock
Don't leave your profits to chance. Historically, this stock follows specific seasonal patterns that institutional traders use to maximize returns.
- ✅ Identify the "Golden Buying Window"
- ✅ Avoid high-risk correction cycles
- ✅ Backtested data from the last 20+ years