May 23, 2025 a 04:44 pm
CMCSA: Fibonacci Analysis - Comcast Corporation
Comcast Corporation, a leader in media and technology sectors worldwide, faces fluctuating market trends influenced by its diverse operations across cable communications, media, studios, and theme parks. The stock has shown volatility amidst these shifts, with recent technical indicators highlighting pivotal movement patterns. Investors should closely monitor Fibonacci levels, as they may reveal potential support and resistance zones critical for decision-making.
Fibonacci Analysis
| Detail | Information |
|---|---|
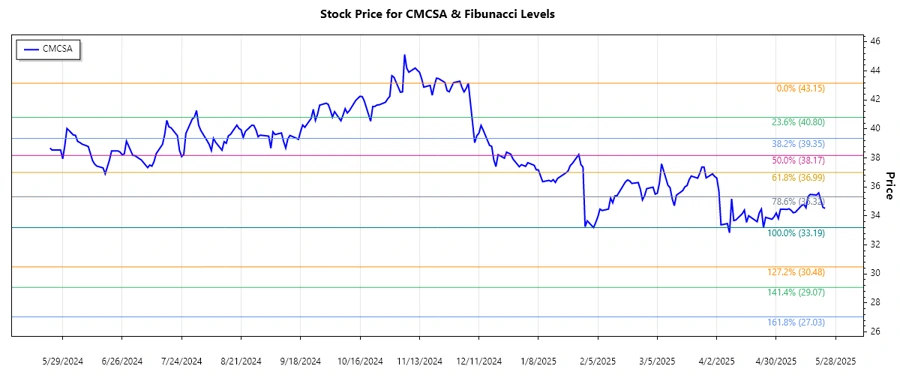
| Trend Type | Down |
| Start Date | 2024-12-06 |
| End Date | 2025-05-23 |
| High Price | $43.15 (2024-12-06) |
| Low Price | $33.19 (2025-04-24) |
| Fibonacci Levels | |
| 0.236 | $35.82 |
| 0.382 | $37.13 |
| 0.5 | $38.17 |
| 0.618 | $39.21 |
| 0.786 | $40.61 |
| Current Price | $34.52 (2025-05-23) |
| Retracement Zone | 0.236 |
| Interpretation | The stock is currently retracing within the 0.236 Fibonacci level, indicating a potential support area. |
Conclusion
Comcast Corporation's stock is undergoing a technical pullback reflective of its broad operational scope and associated market influences. The identification of key Fibonacci levels provides investors with vital benchmarks to gauge potential reversal or continuation zones in the price trend. While the current retracement suggests a potential support scenario, risks are associated with market volatility and underlying business sector performance. A cautious approach with consideration to market fluctuations and updated corporate insights is recommended for stakeholders.
Smart Data Insight
Master the Perfect Entry & Exit for this Stock
Don't leave your profits to chance. Historically, this stock follows specific seasonal patterns that institutional traders use to maximize returns.
- ✅ Identify the "Golden Buying Window"
- ✅ Avoid high-risk correction cycles
- ✅ Backtested data from the last 20+ years