April 18, 2026 a 02:46 am

CMCSA: Dividend Analysis - Comcast Corporation
Comcast Corporation is a prominent player in the telecommunications sector, known for its consistent dividend policies. The company exhibits a robust dividend yield, demonstrating its commitment to providing shareholder value. However, investors should examine the associated risk factors and growth potential before making investment decisions. As a longstanding dividend payer, Comcast has navigated market fluctuations over the years, maintaining its dividend payouts even amidst challenges.
Overview 📊
Comcast operates within the Competitive telecommunications industry, providing a notable dividend yield of 4.71%. With an impressive dividend history spanning 33 years, the current dividend per share is valued at $1.35 USD. Remarkably, Comcast has maintained a stable dividend distribution without any recent cuts or suspensions, a testament to its financial resilience.
| Metric | Details |
|---|---|
| Sector | Telecommunications |
| Dividend yield | 4.71% |
| Current dividend per share | 1.35 USD |
| Dividend history | 33 years |
| Last cut or suspension | None |
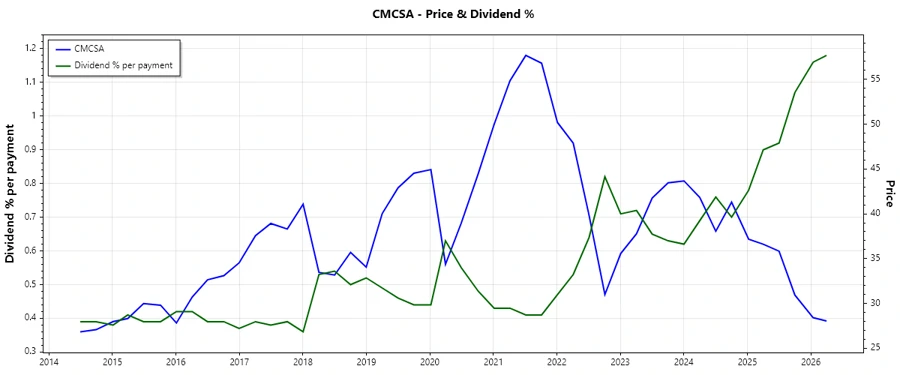
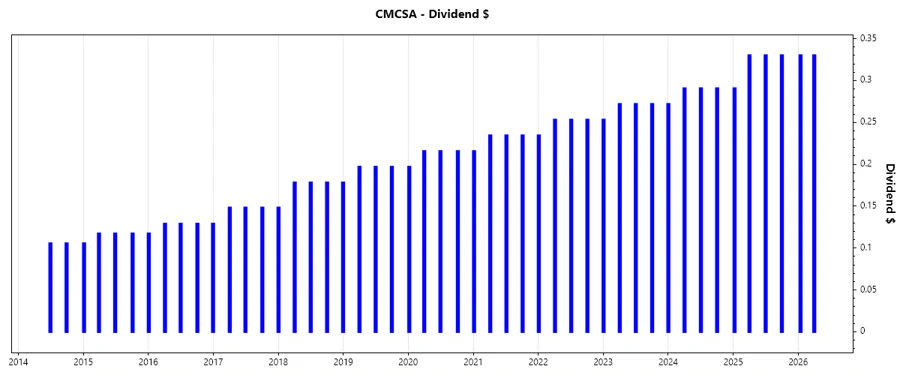
Dividend History 📈
Understanding Comcast’s dividend history is crucial for assessing its reliability as an income-generating stock. The consistent dividend payments over 33 years highlight its stability and commitment to rewarding shareholders.
| Year | Dividend per share (USD) |
|---|---|
| 2026 | 0.66 |
| 2025 | 1.28053 |
| 2024 | 1.14338 |
| 2023 | 1.06842 |
| 2022 | 0.99345 |
Dividend Growth 📉
Analyzing Comcast’s dividend growth provides insight into its ability to increase shareholder returns over time. The company has delivered a stable growth rate over the past years, which is critical for investors seeking to hedge against inflation.
| Time | Growth |
|---|---|
| 3 years | 8.83% |
| 5 years | 8.71% |
The average dividend growth is 8.71% over 5 years. This shows moderate but steady dividend growth.
Payout Ratio ✅
The payout ratio indicates the proportion of earnings and cash flow that is returned to shareholders as dividends. It serves as a metric of sustainability for future payments.
| Key figure | Ratio |
|---|---|
| EPS-based | 24.71% |
| Free cash flow-based | 22.40% |
A payout ratio of 24.71% (EPS) and 22.40% (FCF) indicates a conservative distribution policy, allowing room for reinvestment and future growth.
Cashflow & Capital Efficiency 🗣️
Comcast demonstrates efficient capital allocation strategies, which are pivotal for long-term sustainability. Evaluating cash flow yields and the relationship between CAPEX and cash flow illuminates its financial health and operational efficiency.
| Metric | 2025 | 2024 | 2023 |
|---|---|---|---|
| Free Cash Flow Yield | 21.50% | 10.56% | 7.17% |
| Earnings Yield | 19.45% | 11.04% | 8.51% |
| CAPEX to Operating Cash Flow | 34.93% | 44.02% | 54.52% |
| Stock-based Compensation to Revenue | 0.82% | 1.04% | 1.02% |
| Free Cash Flow / Operating Cash Flow | 65.07% | 55.98% | 45.48% |
These figures suggest a stable cash flow situation and efficient utilization of capital, with a focus on achieving high reinvestment returns and controlled expenses.
Balance Sheet & Leverage Analysis 🗣️
The balance sheet and leverage metrics reflect on Comcast’s capacity to manage its liabilities and maintain liquidity. Proper balance is essential to access financing and sustain its operations.
| Metric | 2025 | 2024 | 2023 |
|---|---|---|---|
| Debt-to-Equity | 1.14 | 1.16 | 1.32 |
| Debt-to-Assets | 40.51% | 37.22% | 41.36% |
| Debt-to-Capital | 53.26% | 53.66% | 56.97% |
| Net Debt to EBITDA | 2.18 | 2.44 | 2.66 |
| Current Ratio | 0.88 | 0.68 | 0.60 |
| Quick Ratio | 0.88 | 0.68 | 0.60 |
| Financial Leverage | 2.81 | 3.11 | 3.20 |
Comcast's leverage ratios indicate a moderate level of indebtedness, demonstrating a balanced approach towards financial obligations and liquidity management.
Fundamental Strength & Profitability 📈
Assessing fundamental strengths along with profitability margins provides insights into Comcast's operational efficiency and competitive advantage within its sector.
| Metric | 2025 | 2024 | 2023 |
|---|---|---|---|
| Return on Equity | 20.44% | 18.92% | 18.61% |
| Return on Assets | 7.26% | 6.08% | 5.81% |
| Net Margin | 16.01% | 13.09% | 12.66% |
| EBIT Margin | 24.39% | 18.43% | 20.21% |
| EBITDA Margin | 37.50% | 30.39% | 31.98% |
| Gross Margin | 60.07% | 58.11% | 57.97% |
| R&D to Revenue | 0% | 0% | 0% |
The strong return ratios and profitability margins mark Comcast as a fundamentally solid entity with considerable profitability in its sector, despite no allocation to R&D expenditure.
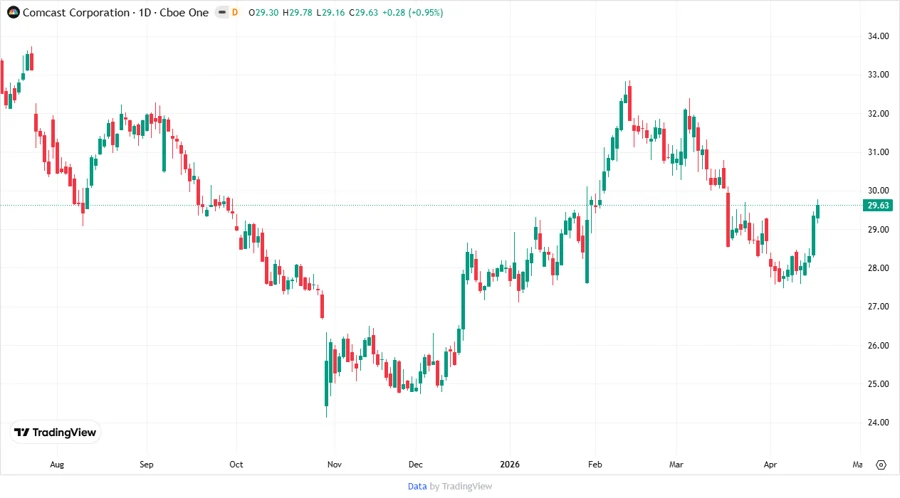
Price Development 📉
Dividend Scoring System ⚠️
| Criteria | Score (1-5) | Bar |
|---|---|---|
| Dividend yield | 4 | |
| Dividend Stability | 5 | |
| Dividend growth | 4 | |
| Payout ratio | 5 | |
| Financial stability | 4 | |
| Dividend continuity | 5 | |
| Cashflow Coverage | 4 | |
| Balance Sheet Quality | 4 |
Total Score: 35/40
Rating 🟢
Comcast Corporation stands as a resilient choice for dividend investors, showcasing a strong commitment to shareholder returns through steady and reliable dividend distributions. Its financial strategies and profit-based metrics confirm Comcast's ability to sustain and potentially enhance dividend payouts, making it a prudent choice for income-focused investors who value stability along with moderate growth prospects.