February 24, 2026 a 11:31 am


CMCSA: Dividend Analysis - Comcast Corporation
Comcast Corporation has consistently delivered strong dividends for over 33 years, making it a staple in the telecommunications sector. With a current dividend yield of 4.04% and no recent cuts, it remains an attractive option for dividend investors. The company demonstrates solid financial management, modest payout ratios, and consistent dividend growth despite market fluctuations.
Overview 📊
Comcast Corporation, operating in the Telecommunications sector, presents a promising dividend profile with a dividend yield of 4.04% from a current dividend per share of $1.35. The company's consistent dividend history of 33 years without cuts demonstrates resilience and commitment to returning capital to shareholders.
| Sector | Dividend Yield | Current Dividend Per Share | Dividend History | Last Cut/Suspension |
|---|---|---|---|---|
| Telecommunications | 4.04% | $1.35 | 33 years | None |
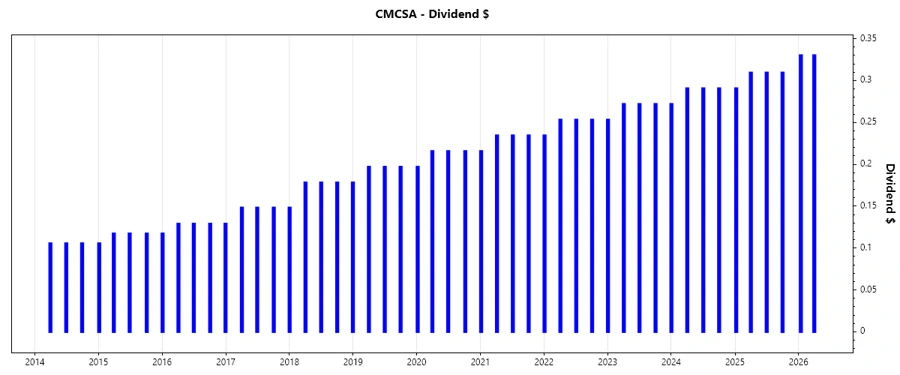
Dividend History 📈
Comcast has consistently increased its dividend payments over the years, underscoring its commitment to shareholders and its financial strength. This growth is crucial for investors seeking income growth in addition to stability.
| Year | Dividend Per Share (USD) |
|---|---|
| 2026 | 0.66 |
| 2025 | 1.21837 |
| 2024 | 1.14338 |
| 2023 | 1.06842 |
| 2022 | 0.99345 |
Dividend Growth 📈
Dividend growth is a key indicator of a company's future dividend prospects. Comcast's growth rates of 7.04% over three years and 7.63% over five years suggest a moderate yet reliable increase, indicating potential for increased future payouts.
| Time | Growth |
|---|---|
| 3 years | 7.04% |
| 5 years | 7.63% |
The average dividend growth is 7.63% over 5 years. This shows moderate but steady dividend growth.
Payout Ratio 🗣️
The payout ratio is a critical metric that indicates the sustainability of dividend payments. Comcast maintains a payout ratio of 24.71% based on EPS and 22.40% based on FCF, reflecting a conservative approach that balances shareholder returns with financial health.
| Key Figure | Ratio |
|---|---|
| EPS-based | 24.71% |
| Free Cash Flow-based | 22.40% |
These payout ratios indicate a well-managed payout strategy, ensuring both attractive dividends and retained earnings for future investments and debt management.
Cashflow & Capital Efficiency 💰
Maintaining positive cash flow and efficient capital use is crucial for sustaining dividend payouts. Comcast's financial metrics, such as a Free Cash Flow Yield of 21.5% and Earnings Yield of 19.4%, demonstrate robust cash-generating ability.
| Year | 2025 | 2024 | 2023 |
|---|---|---|---|
| Free Cash Flow Yield | 21.50% | 10.56% | 7.17% |
| Earnings Yield | 19.45% | 11.04% | 8.51% |
| CAPEX to Operating Cash Flow | 34.93% | 44.02% | 54.52% |
| Stock-based Compensation to Revenue | 0% | 1.04% | 1.02% |
| Free Cash Flow / Operating Cash Flow Ratio | 65.07% | 55.98% | 45.48% |
Comcast's cash flow metrics and capital efficiency ratios reflect a strong ability to support consistent dividends and reinvest in growth opportunities.
Balance Sheet & Leverage Analysis 📊
A sound balance sheet and leverage management are vital for sustainability during economic downturns. Comcast's financial indicators confirm a well-structured debt profile with adequate liquidity.
| Year | 2025 | 2024 | 2023 |
|---|---|---|---|
| Debt-to-Equity | 1.14 | 1.16 | 1.32 |
| Debt-to-Assets | 40.51% | 37.22% | 41.36% |
| Debt-to-Capital | 53.26% | 53.66% | 56.97% |
| Net Debt to EBITDA | 2.18 | 2.44 | 2.66 |
| Current Ratio | 0.88 | 0.68 | 0.60 |
| Quick Ratio | 0.88 | 0.68 | 0.60 |
| Financial Leverage | 2.81 | 3.11 | 3.20 |
Comcast's leverage ratios are stable, suggesting manageable debt levels and liquidity to sustain the company's dividend policy.
Fundamental Strength & Profitability 📈
Evaluating fundamental strengths and profitability indicators helps assess overall financial health. Comcast's consistent return on equity and stable margins highlight its operational efficiency and profit-generating capabilities.
| Year | 2025 | 2024 | 2023 |
|---|---|---|---|
| Return on Equity | 20.44% | 18.92% | 18.61% |
| Return on Assets | 7.26% | 6.08% | 5.81% |
| Net Profit Margin | 16.01% | 13.08% | 12.66% |
These profitability ratios illustrate Comcast's strong ability to convert revenues into profit, which supports the sustainability of its dividend payments.
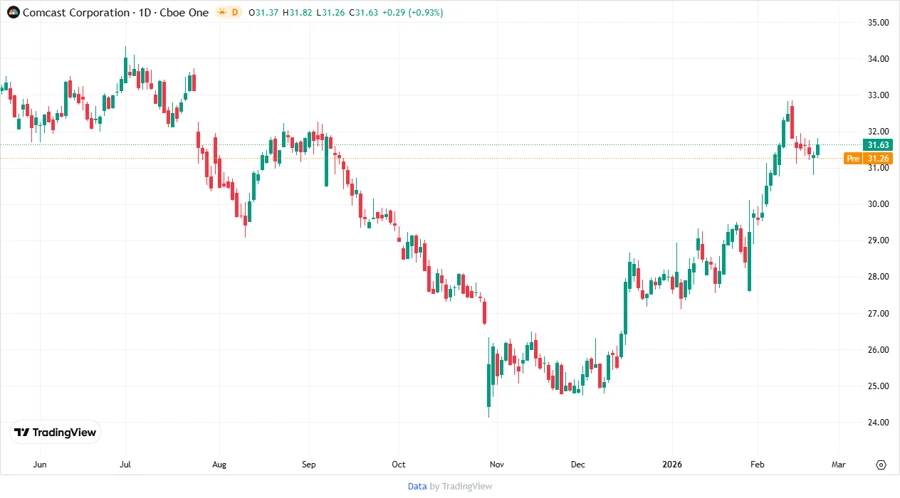
Price Development 📉
Dividend Scoring System ✅
Our customized scoring system evaluates various dividend sustainability and growth factors:
| Category | Score | Visualization |
|---|---|---|
| Dividend Yield | 4 | |
| Dividend Stability | 5 | |
| Dividend Growth | 3 | |
| Payout Ratio | 4 | |
| Financial Stability | 4 | |
| Dividend Continuity | 5 | |
| Cashflow Coverage | 4 | |
| Balance Sheet Quality | 3 |
Total Score: 32/40
Rating 🏆
Comcast Corporation presents an attractive investment opportunity for income-focused investors, given its reliable dividend payments and solid financial management. With an overall dividend score of 32 out of 40, it remains a robust choice for sustainable dividend growth and stability, with moderate growth potential and reasonable risk management. We recommend continued observation with the potential for incremental investments in alignment with yield objectives.
Smart Data Insight
Master the Perfect Entry & Exit for this Stock
Don't leave your profits to chance. Historically, this stock follows specific seasonal patterns that institutional traders use to maximize returns.
- ✅ Identify the "Golden Buying Window"
- ✅ Avoid high-risk correction cycles
- ✅ Backtested data from the last 20+ years