June 19, 2025 a 03:31 am


CMCSA: Dividend Analysis - Comcast Corporation
Comcast Corporation has demonstrated a strong commitment to maintaining and growing its dividends, delivering consistent payouts over several decades. The company's resilience in diverse market conditions, combined with its robust financial metrics, make it a reliable choice for income-focused investors. While the payout ratios are sustainable, ongoing analysis is crucial to ensure continued performance in rapidly changing markets.
Overview
| Metric | Value |
|---|---|
| Sector | Telecommunications |
| Dividend yield | 3.74 % |
| Current dividend per share | $1.23 USD |
| Dividend history | 32 years |
| Last cut or suspension | None |
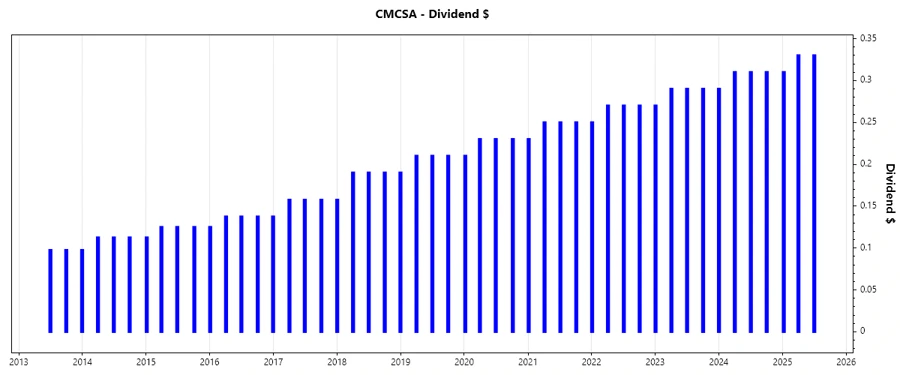
Dividend History
Comcast's dividend history exemplifies its commitment to shareholders, showcasing stability and periodic growth. This track record is significant for investors seeking reliable income, reflecting Comcast's stability and robust earnings over time.
| Year | Dividend per Share (USD) |
|---|---|
| 2025 | $0.97 |
| 2024 | $1.22 |
| 2023 | $1.14 |
| 2022 | $1.06 |
| 2021 | $0.98 |
Dividend Growth
Analyzing dividend growth provides insights into potential income enhancement over time. Comcast's steady growth rate exemplifies its strategic management and capacity to enhance shareholder value through progressive dividend policies.
| Time | Growth |
|---|---|
| 3 years | 7.57 % |
| 5 years | 14.13 % |
The average dividend growth is 14.13 % over 5 years. This shows moderate but steady dividend growth.
Payout Ratio
The payout ratio assesses both the sustainability of dividends and the remaining profit for reinvestment. Comcast's EPS-based payout ratio of 29.36% and FCF-based ratio of 30.68% both reflect a prudent dividend policy, allowing room for future growth while maintaining shareholder returns.
| Key figure ratio | Value |
|---|---|
| EPS-based | 29.36 % |
| Free cash flow-based | 30.68 % |
Cashflow & Capital Efficiency
Cashflow metrics offer critical insights into the operational efficiency and financial health of Comcast, allowing for a nuanced evaluation of its ability to sustain dividends and reinvest in growth. The observed metrics suggest Comcast maintains robust operational cash flow and efficient capital allocation, ensuring long-term value creation.
| Year | Free Cash Flow Yield | Earnings Yield | CAPEX/Operating Cash Flow | Stock-based Comp./Revenue | FCF/Operating Cash Flow | Return on Invested Capital |
|---|---|---|---|---|---|---|
| 2024 | 10.56% | 11.04% | 44.02% | 1.04% | 55.98% | 11.57% |
| 2023 | 7.17% | 8.51% | 54.52% | 1.02% | 45.48% | 7.59% |
| 2022 | 8.21% | 3.49% | 52.12% | 1.10% | 47.88% | 5.07% |
Balance Sheet & Leverage Analysis
Understanding the leverage and liquidity positions is crucial for evaluating Comcast's capacity to weather financial disruptions while expanding its revenue base. The company's stability is showcased by its effective leverage management and solid short-term liquidity ratios, supporting continued operational resilience.
| Year | Debt-to-Equity | Debt-to-Assets | Debt-to-Capital | Net Debt/EBITDA | Current Ratio | Quick Ratio | Financial Leverage |
|---|---|---|---|---|---|---|---|
| 2024 | 115.82% | 37.22% | 53.66% | 3.13 | 0.68 | 0.68 | 3.11 |
| 2023 | 117.40% | 36.66% | 54.00% | 2.34 | 0.60 | 0.60 | 3.20 |
| 2022 | 123.52% | 38.86% | 55.26% | 2.61 | 0.78 | 0.78 | 3.18 |
Fundamental Strength & Profitability
Reviewing fundamental metrics provides insights into Comcast's operational prowess and competitive edge. With substantial profitability margins and efficient resource deployment, Comcast remains well-positioned to navigate industry challenges while delivering shareholder value.
| Year | Return on Equity | Return on Assets | Net Margin | EBIT Margin | EBITDA Margin | Gross Margin | R&D/Revenue |
|---|---|---|---|---|---|---|---|
| 2024 | 18.92% | 6.08% | 13.09% | 11.75% | 23.71% | 70.08% | 0% |
| 2023 | 18.61% | 5.81% | 12.66% | 20.21% | 31.99% | 69.76% | 0% |
| 2022 | 6.63% | 2.09% | 4.42% | 10.85% | 30.01% | 68.53% | 0% |
Price Development
Dividend Scoring System
| Category | Score | Score Bar |
|---|---|---|
| Dividend yield | 4 | |
| Dividend Stability | 5 | |
| Dividend growth | 4 | |
| Payout ratio | 3 | |
| Financial stability | 4 | |
| Dividend continuity | 5 | |
| Cashflow Coverage | 4 | |
| Balance Sheet Quality | 3 |
Total Score: 32/40
Rating
Comcast Corporation's financial stability, strong dividend performance, and growth prospects make it a favorable candidate for dividend-focused investors. Its prudent payout ratios balance growth with shareholder returns, although attention to market fluctuations and strategic flexibility will remain essential for sustaining its current success.
Smart Data Insight
Master the Perfect Entry & Exit for this Stock
Don't leave your profits to chance. Historically, this stock follows specific seasonal patterns that institutional traders use to maximize returns.
- ✅ Identify the "Golden Buying Window"
- ✅ Avoid high-risk correction cycles
- ✅ Backtested data from the last 20+ years