June 04, 2026 a 04:03 am

CL: Trend and Support & Resistance Analysis - Colgate-Palmolive Company
Colgate-Palmolive Company has demonstrated resilience in its stock performance with a mixed trend observed in recent months. Analyzing technical indicators, investors should be poised for moderate movements either upwards or downwards, with support and resistance levels being crucial for short-term strategies. The company's solid foothold in consumer goods, complemented by its diversified product portfolio, remains a fundamental strength amidst market fluctuations.
Trend Analysis
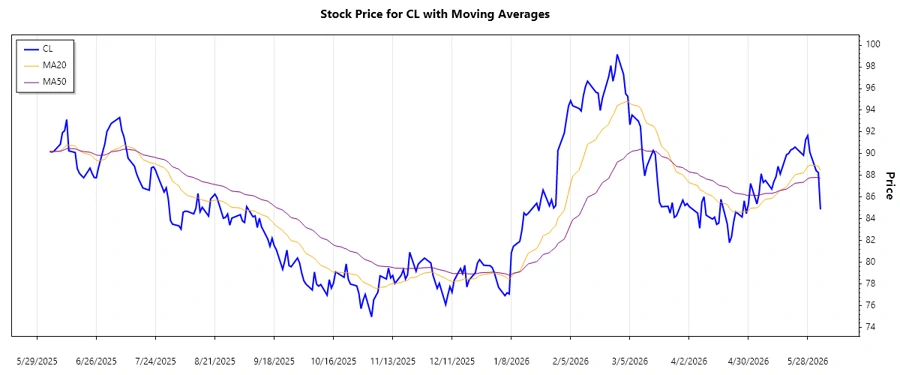
The CL stock exhibits a recent directional change. Using EMA20 and EMA50 indicators, a clearer picture emerges: A bullish crossover occurred, indicating potential upward momentum.
| Date | Closing Price | Trend |
|---|---|---|
| 2026-06-03 | 84.87 | ▲ Upward |
| 2026-06-02 | 88.27 | ▼ Downward |
| 2026-06-01 | 88.43 | ▲ Upward |
| 2026-05-29 | 90.13 | ▼ Downward |
| 2026-05-28 | 91.66 | ▲ Upward |
| 2026-05-27 | 91.29 | ▼ Downward |
| 2026-05-26 | 89.85 | ▲ Upward |
The analysis shows fluctuations, but the EMA cross suggests an upward motion that can lead to higher prices if maintained.
Support and Resistance
An evaluation of historical data defines the following support and resistance zones:
| Zone Type | From | To |
|---|---|---|
| Support Zone 1 | 84.00 | 85.00 |
| Support Zone 2 | 82.00 | 83.00 |
| Resistance Zone 1 | 88.00 | 89.00 |
| Resistance Zone 2 | 91.00 | 92.00 |
The stock is currently situated close to the first resistance zone. A break above might indicate further bullish moves.
The stock of Colgate-Palmolive remains in a cautiously optimistic environment, with technical indicators pointing to possible upward movements. Monitoring the EMA crossovers and the pivotal support and resistance levels will be crucial for decision making. While there are opportunities for gains, investors must also be aware of potential resistances that could limit upward momentum. Understanding the stock’s response around these technical levels can provide a strategic advantage.
Smart Data Insight
Master the Perfect Entry & Exit for this Stock
Don't leave your profits to chance. Historically, this stock follows specific seasonal patterns that institutional traders use to maximize returns.
- ✅ Identify the "Golden Buying Window"
- ✅ Avoid high-risk correction cycles
- ✅ Backtested data from the last 20+ years