May 17, 2026 a 03:31 am

📊 Dividend Analysis - Colgate-Palmolive Company
Colgate-Palmolive Company has been a consistent dividend-paying stock, with a remarkable history of 54 consecutive years of dividend payments. The company's current dividend yield stands at approximately 2.50%, with a dividend per share of $2.25. While the dividend growth over the past five years averages around 3.31%, which suggests steady but slow growth. Based in the Consumer Goods sector, Colgate-Palmolive is a staple investment for income-seeking investors.
Overview
As part of the Consumer Goods sector, Colgate-Palmolive Company presents a stable growth profile with a dividend yield of 2.50%. The company has maintained a consistent dividend history for 54 years without significant suspensions or cuts recently, showcasing its reliability as a dividend-paying stock.
| Metric | Details |
|---|---|
| Sector | Consumer Goods |
| Dividend Yield | 2.50% |
| Current Dividend per Share | $2.25 |
| Dividend History | 54 years |
| Last Cut or Suspension | None |
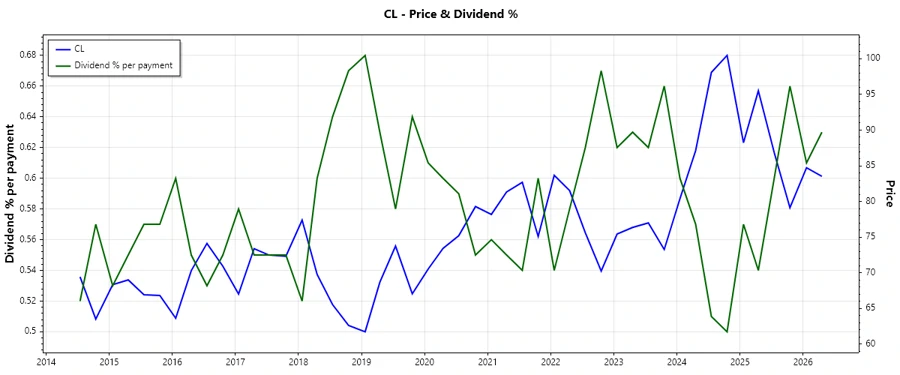
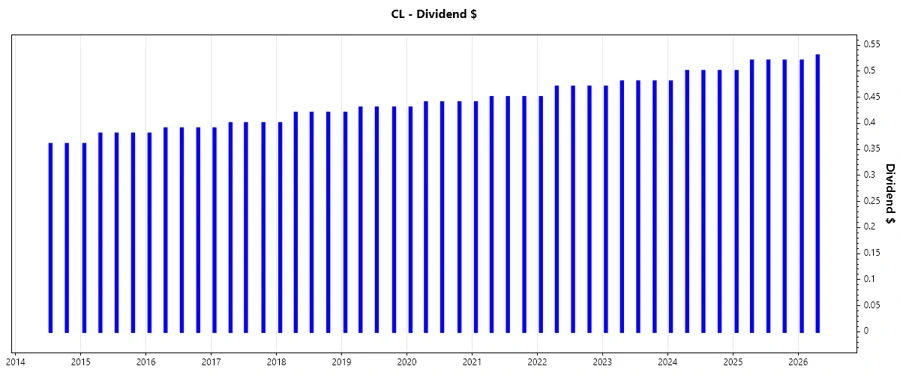
Dividend History
The importance of a robust dividend history cannot be overstated as it highlights the company's commitment to return value to its shareholders consistently. Colgate-Palmolive's victory in sustaining dividend payouts for over five decades is a testament to its durable business model.
| Year | Dividend per Share (USD) |
|---|---|
| 2026 | 1.05 |
| 2025 | 2.06 |
| 2024 | 1.98 |
| 2023 | 1.91 |
| 2022 | 1.86 |
Dividend Growth
Dividend growth is a significant factor to consider when evaluating dividend stocks. It showcases the company's ability to increase shareholder value over time. Colgate-Palmolive has demonstrated a modest growth pattern in its dividends over the years.
| Time | Growth |
|---|---|
| 3 years | 3.46% |
| 5 years | 3.31% |
The average dividend growth is 3.31% over 5 years. This shows moderate but steady dividend growth.
Payout Ratio
The payout ratio is a crucial metric showing what portion of earnings or cash flows are allocated to dividend payments. A high payout ratio may indicate limited room for dividend growth.
| Key Figure | Ratio |
|---|---|
| EPS-based | 86.66% |
| Free Cash Flow-based | 47.88% |
With an EPS-based payout ratio of 86.66%, the dividends are well-covered, though approaching the higher range, limiting future growth. The Free Cash Flow-based payout ratio of 47.88% suggests more sustainable coverage.
Cashflow & Capital Efficiency
A thorough analysis of free cash flow and capital efficiency ratios provides insights into the company's ability to fund its operations, growth, and dividends internally, impacting its financial health.
| Year | 2025 | 2024 | 2023 |
|---|---|---|---|
| Free Cash Flow Yield | 5.69% | 4.77% | 4.61% |
| Earnings Yield | 3.34% | 3.89% | 3.49% |
| CAPEX to Operating Cash Flow | 13.33% | 13.66% | 18.83% |
| Stock-based Compensation to Revenue | N/A | 0.67% | 0.63% |
| Free Cash Flow / Operating Cash Flow Ratio | 86.57% | 86.34% | 81.17% |
The cash flows and capital efficiency indicators illustrate robust cash generation capabilities, vital for supporting ongoing dividends while also allowing for strategic reinvestments.
Balance Sheet & Leverage Analysis
Understanding the leverage and capital structure is essential to assessing the company's financial stability and resilience against economic downturns.
| Year | 2025 | 2024 | 2023 |
|---|---|---|---|
| Debt-to-Equity | 147.93 | 40.15 | 14.88 |
| Debt-to-Assets | 48.92% | 53.05% | 55.29% |
| Debt-to-Capital | 99.33% | 97.57% | 93.70% |
| Net Debt to EBITDA | 1.69 | 1.53 | 1.91 |
| Current Ratio | 1.00 | 0.92 | 1.11 |
| Quick Ratio | 0.64 | 0.58 | 0.71 |
| Financial Leverage | 302.41 | 75.69 | 26.92 |
While the high leverage ratios suggest greater risk, the company's strong interest coverage and current ratios indicate sufficient liquidity to manage its obligations.
Fundamental Strength & Profitability
Key profitability margins and returns provide insight into the business's performance quality, efficiency, and market competitiveness.
| Year | 2025 | 2024 | 2023 |
|---|---|---|---|
| Return on Equity | 39.48% | 13.63% | 3.78% |
| Return on Assets | 13.06% | 18.00% | 14.03% |
| Net Margin | 10.46% | 14.37% | 11.82% |
| EBIT Margin | 16.32% | 21.13% | 18.91% |
| EBITDA Margin | 19.41% | 24.14% | 21.82% |
| Gross Margin | 60.11% | 60.23% | 57.82% |
| Research & Development to Revenue | 0% | 1.77% | 1.76% |
While the return on equity indicator shows significant variation, the company's profitability through stable EBITDA and gross margins represents resilient operational efficiency.
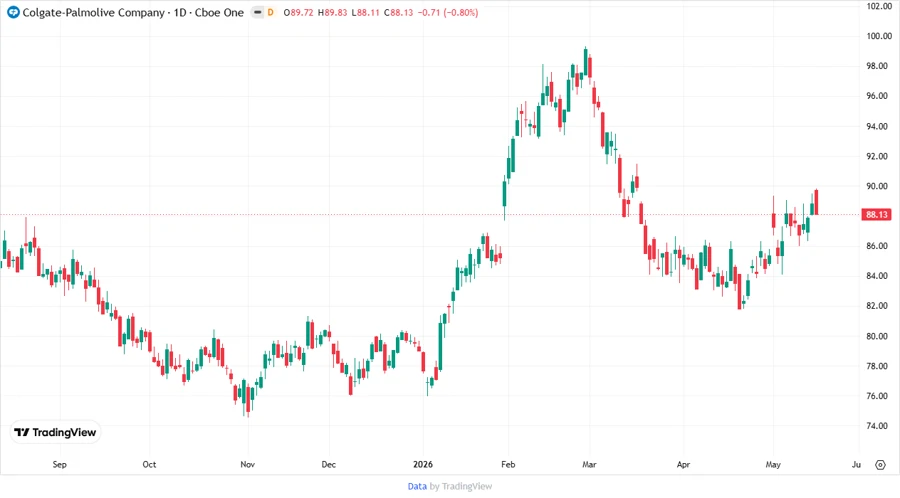
Price Development
Dividend Scoring System
| Criteria | Description | Score |
|---|---|---|
| Dividend Yield | Relatively stable yield compared to peers | 3 |
| Dividend Stability | 54 consecutive years of payouts | 5 |
| Dividend Growth | Steady, moderate growth over 5 years | 3 |
| Payout Ratio | High but sustainable payout ratio | 3 |
| Financial Stability | Strong liquidity despite high leverage | 4 |
| Dividend Continuity | No recent cuts or suspensions | 5 |
| Cashflow Coverage | Solid free cash flow coverage of dividends | 4 |
| Balance Sheet Quality | Stability in financial position | 3 |
Total Score: 30/40
Rating
✅ Colgate-Palmolive Company demonstrates a resilient dividend profile with over half a century of continuous dividend payouts and moderate growth. The financials suggest a strong backing to support dividends despite high leverage, making this a suitable option for income-focused investors seeking steady returns.
Smart Data Insight
Master the Perfect Entry & Exit for this Stock
Don't leave your profits to chance. Historically, this stock follows specific seasonal patterns that institutional traders use to maximize returns.
- ✅ Identify the "Golden Buying Window"
- ✅ Avoid high-risk correction cycles
- ✅ Backtested data from the last 20+ years