September 08, 2025 a 02:48 am


CL: Dividend Analysis - Colgate-Palmolive Company
Colgate-Palmolive Company stands as a beacon of stability in the dividend market with a remarkable 53-year track record of uninterrupted dividend payments. The company's dividend yield of 2.35% is coupled with consistent dividend growth over the years. Despite a high payout ratio, the financial stability and robust cash flow efficiency reflect a strong ability to sustain this shareholder-friendly policy.
📊 Overview
With its presence in the Consumer Staples sector, Colgate-Palmolive has maintained a solid dividend yield of 2.35% with a current dividend per share of $2.19. This unwavering commitment is evident from its 53-year history of consecutive dividend payments with no recent cuts or suspensions, showcasing resilience in delivering value to its shareholders.
| Sector | Dividend Yield | Current Dividend per Share | Dividend History | Last Cut or Suspension |
|---|---|---|---|---|
| Consumer Staples | 2.35% | $2.19 | 53 years | None |
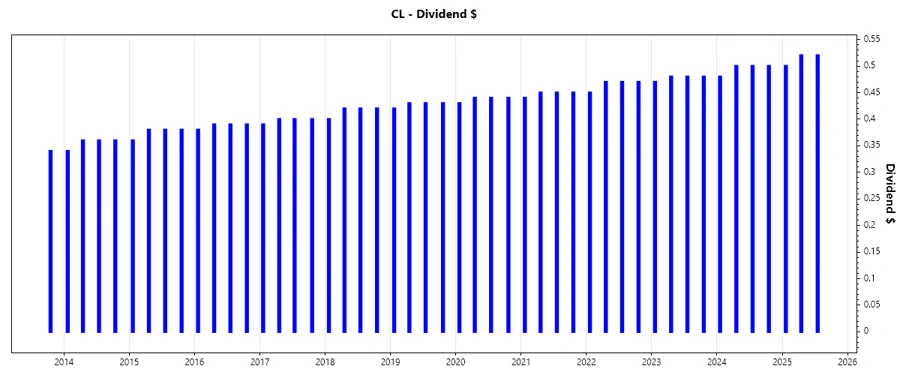
🗣️ Dividend History
Understanding the dividend history offers insight into Colgate-Palmolive's commitment to its shareholders. With over five decades of retention, the company has demonstrated reliability in delivering returns. This historical perspective is crucial for long-term investors seeking stable income streams.
| Year | Dividend per Share |
|---|---|
| 2025 | $1.54 |
| 2024 | $1.98 |
| 2023 | $1.91 |
| 2022 | $1.86 |
| 2021 | $1.79 |
📈 Dividend Growth
The growth in dividends is a testament to Colgate-Palmolive's ability to increase shareholder value over time. Stable growth over three and five years indicates the company's strategic foresight and sound financial decisions in supporting progressive dividends.
| Time | Growth |
|---|---|
| 3 years | 3.42% |
| 5 years | 2.98% |
The average dividend growth is 2.98% over 5 years. This shows moderate but steady dividend growth.
📉 Payout Ratio
The payout ratio is critical in assessing sustainability. While Colgate-Palmolive's EPS-based payout ratio stands at 60.74% and FCF-based at 52.47%, it shows a commitment to maintaining dividends while ensuring adequate reinvestment in the business.
| Key Figure | Ratio |
|---|---|
| EPS-based | 60.74% |
| Free cash flow-based | 52.47% |
With a balanced EPS payout ratio of 60.74%, Colgate-Palmolive exhibits a cautiously optimistic approach to managing earnings and strategic growth.
✅ Cashflow & Capital Efficiency
Evaluating cash flow and capital efficiency provides insight into operational effectiveness and future investment potentials. With a solid Free Cash Flow Yield of 4.90% and earnings yield at 4.23%, Colgate has positioned itself well for continued financial health and shareholder returns.
| Fiscal Year | 2022 | 2023 | 2024 |
|---|---|---|---|
| Free Cash Flow Yield | 2.82% | 4.61% | 4.77% |
| Earnings Yield | 2.71% | 3.49% | 3.89% |
| CAPEX to Operating Cash Flow | 27.23% | 18.83% | 13.66% |
| Stock-based Compensation to Revenue | 0.70% | 0.63% | 0.67% |
| Free Cash Flow / Operating Cash Flow Ratio | 72.77% | 81.17% | 86.34% |
The company's operational cash flow remains robust, signaling strong cash generation capabilities underpinning sound investment and shareholder return prospects.
⚠️ Balance Sheet & Leverage Analysis
Balance sheet analysis indicates financial stability. Healthy leverage ratios and debt management reflect Colgate's financial prudence, securing its position even in volatile markets.
| Fiscal Year | 2022 | 2023 | 2024 |
|---|---|---|---|
| Debt-to-Equity | 23.12% | 14.88% | 40.15% |
| Debt-to-Assets | 58.93% | 55.29% | 53.05% |
| Debt-to-Capital | 95.85% | 93.70% | 97.57% |
| Net Debt to EBITDA | 2.52 | 1.91 | 1.53 |
| Current Ratio | 1.28 | 1.11 | 0.92 |
| Quick Ratio | 0.76 | 0.71 | 0.58 |
| Financial Leverage | 39.23% | 26.92% | 75.69% |
The solid handling of debt and liquidity places Colgate-Palmolive in a favorable position to withstand external shocks and continue fulfilling its dividend promises.
📈 Fundamental Strength & Profitability
The company’s solid fundamentals indicate a robust profitability framework, vital in maintaining long-term economical advantages and attractive market positioning.
| Fiscal Year | 2022 | 2023 | 2024 |
|---|---|---|---|
| Return on Equity | 4.45% | 3.78% | 13.63% |
| Return on Assets | 11.35% | 14.03% | 18.00% |
| Net Profit Margin | 9.93% | 11.82% | 14.37% |
| EBIT Margin | 15.73% | 18.91% | 21.13% |
| EBITDA Margin | 18.77% | 21.82% | 24.14% |
| Gross Margin | 56.49% | 57.82% | 60.23% |
| Research & Development to Revenue | 1.78% | 1.76% | 1.77% |
Strong profitability ratios coupled with robust gross and net margins showcase Colgate-Palmolive's aptness in converting sales into actual earnings.
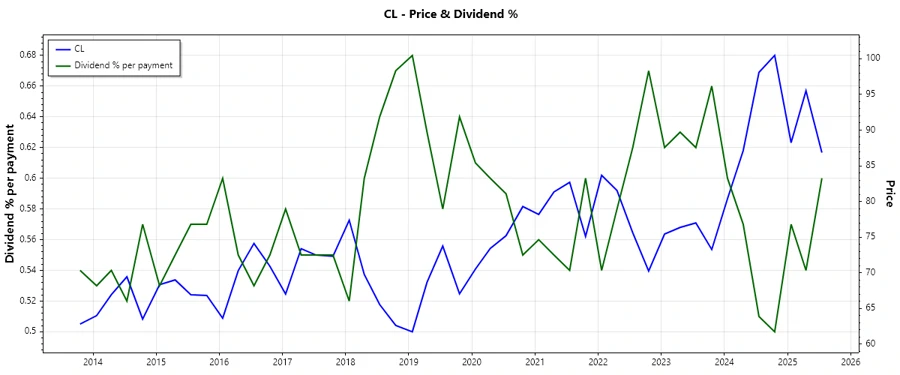
✅ Price Development
🏆 Dividend Scoring System
| Criterion | Score | |
|---|---|---|
| Dividend Yield | 4 | |
| Dividend Stability | 5 | |
| Dividend Growth | 3 | |
| Payout Ratio | 3 | |
| Financial Stability | 4 | |
| Dividend Continuity | 5 | |
| Cashflow Coverage | 4 | |
| Balance Sheet Quality | 4 |
Total Score: 32/40
🔍 Rating
Colgate-Palmolive showcases a compelling dividend profile characterized by unwavering consistency and satisfactory growth. Despite the slightly elevated payout ratio, prudence in financial management assures continued commitments to dividends. Colgate-Palmolive emerges as a sturdy choice for investors focused on sustained income and reliability.
Smart Data Insight
Master the Perfect Entry & Exit for this Stock
Don't leave your profits to chance. Historically, this stock follows specific seasonal patterns that institutional traders use to maximize returns.
- ✅ Identify the "Golden Buying Window"
- ✅ Avoid high-risk correction cycles
- ✅ Backtested data from the last 20+ years