April 08, 2026 a 06:44 am
CLX: Fibonacci Analysis - The Clorox Company
The Clorox Company has shown resilience in its diverse consumer and professional products market. However, the recent historical price patterns suggest a notable downturn from previous highs. As such, close attention to technical indicators like Fibonacci retracement levels is essential for understanding possible future movements and identifying potential support or resistance zones.
Fibonacci Analysis
| Trend Details | Information |
|---|---|
| Start Date | 2025-04-08 |
| End Date | 2026-04-07 |
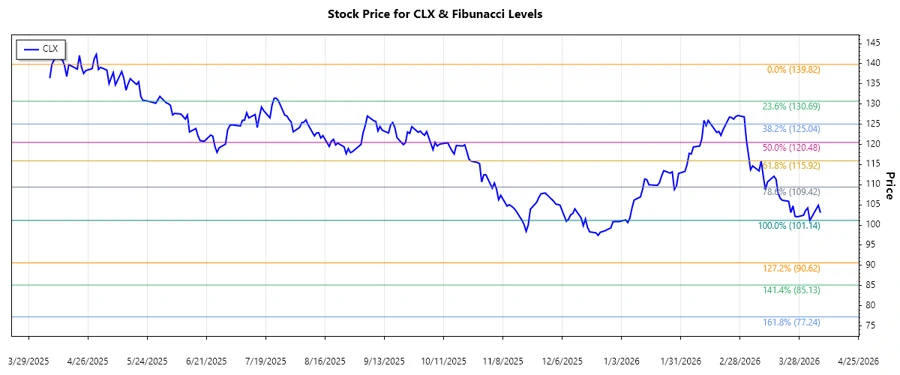
| High Price (Date) | $139.82 (2025-04-08) |
| Low Price (Date) | $101.14 (2026-04-02) |
| Fibonacci Level | Price |
|---|---|
| 0.236 | $110.96 |
| 0.382 | $116.64 |
| 0.5 | $120.48 |
| 0.618 | $124.32 |
| 0.786 | $130.10 |
The current price is approximately $103.04, which is outside notable Fibonacci retracement levels, signaling a potential continuation of the bearish sentiment. This indicates a significant resistance zone challenged by downward pressures.
Conclusion
The Clorox Company is experiencing a notable downward trend. While the firm maintains a strong market presence, recent declines in stock price require vigilance. Technical indicators suggest that further drops could hit significant Fibonacci support levels, marking potential price stabilization opportunities. Conversely, failing to establish support could open the door to additional price weakening. Analysts must weigh these scenarios when considering long-term investment strategies in the context of Clorox's overall market performance.