February 05, 2026 a 11:44 am
CLX: Fibonacci Analysis - The Clorox Company
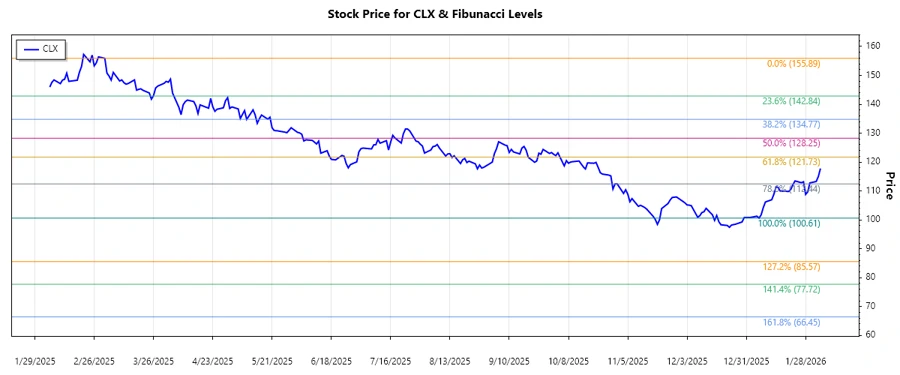
The Clorox Company, known for its diverse range of consumer and professional products, has shown resilience in the market. Recent months have displayed a fluctuating trend, ultimately settling into a dominant downward trajectory. Analysts are closely watching the stock for potential recovery signs or further decline. Technical indicators, such as the Fibonacci Retracement, are key tools in predicting future price movements of CLX.
Fibonacci Analysis
| Trend Analysis | Details |
|---|---|
| Start Date | 2025-03-03 |
| End Date | 2026-02-04 |
| High Point (Price & Date) | $155.89 on 2025-03-03 |
| Low Point (Price & Date) | $100.61 on 2026-01-06 |
Fibonacci Retracement Levels
| Level | Price |
|---|---|
| 0.236 | $112.45 |
| 0.382 | $121.22 |
| 0.500 | $127.75 |
| 0.618 | $134.28 |
| 0.786 | $144.47 |
The current price of $117.77 indicates that CLX is within the 0.236 - 0.382 retracement zone. This suggests potential resistance in the near term, with a chance for a reversal if the price sustains above the 0.382 level.
Conclusion
The analysis indicates that The Clorox Company is experiencing a downward trend, setting significant support and resistance levels. The stock's movement within critical Fibonacci levels suggests a cautious approach for investors, with resistance expected at higher retracement zones. While the company's diverse product range provides stability, external factors and market conditions could influence its stock performance. Analysts should remain vigilant, keeping an eye on both technical indicators and macroeconomic developments. The technical analysis provides a useful guide, but investors must consider broader market sentiments and the company's strategic initiatives.