October 25, 2025 a 11:45 am

CLX: Fibunacci Analysis - The Clorox Company
The Clorox Company, a well-established player in the consumer and professional products market, has recently experienced a notable bearish trend. The decline in stock prices over the last few months could be reflective of challenges faced in its various segments, particularly the Health and Wellness and Household divisions. Investors may be cautious, as external market factors and internal strategic shifts continue to impact the company's performance.
Fibonacci Analysis
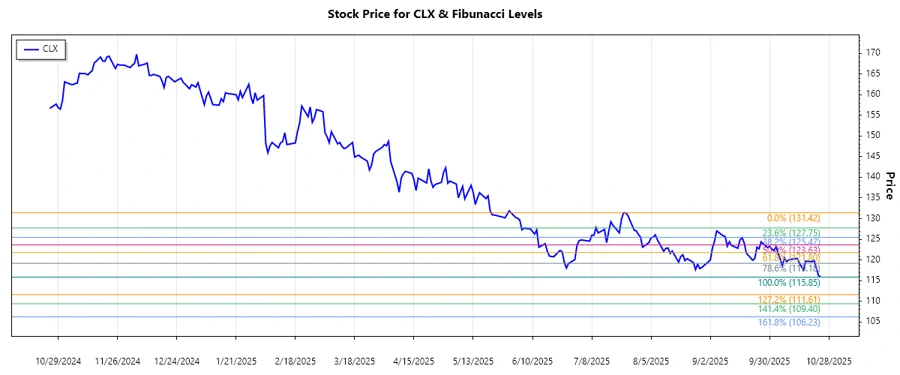
Based on the recent downward trend observed from July 25, 2025, to October 24, 2025, the Fibonacci Retracement levels have been calculated from the high of $131.42 to the low of $115.85. These levels offer potential price targets and support/resistance points for the stock.
| Start Date | End Date | High (Price & Date) | Low (Price & Date) |
|---|---|---|---|
| 2025-07-25 | 2025-10-24 | $131.42 (2025-07-24) | $115.85 (2025-10-24) |
| Fibonacci Level | Price Level |
|---|---|
| 0.236 | $120.22 |
| 0.382 | $122.57 |
| 0.5 | $123.64 |
| 0.618 | $125.71 |
| 0.786 | $128.36 |
Currently, the stock price is at $115.85, outside typical retracement levels, indicating a significant bearish sentiment. If the price enters 0.236, it may find some resistance.
In conclusion, these Fibonacci levels suggest potential supports and resistances in this bearish outlook. If prices rise back to these levels, traders might anticipate short-term bouncebacks or further declines based on broader market conditions.
Conclusion
The Clorox Company is experiencing a significant downtrend, presenting a cautious outlook for investors and analysts. The calculated Fibonacci levels indicate key repositioning opportunities in case of reversal, providing guidance on possible entry and exit points. External factors such as economic conditions, competitive pressure, and organizational strategies are crucial determinants of future momentum. The stock currently exhibits bearish patterns with limited upwards movement within the retracement levels. Continuous monitoring is recommended to make informed trading decisions, as volatility may affect the established support and resistance lines.
Smart Data Insight
Master the Perfect Entry & Exit for this Stock
Don't leave your profits to chance. Historically, this stock follows specific seasonal patterns that institutional traders use to maximize returns.
- ✅ Identify the "Golden Buying Window"
- ✅ Avoid high-risk correction cycles
- ✅ Backtested data from the last 20+ years