October 05, 2025 a 10:15 am
CLX: Fibonacci Analysis - The Clorox Company
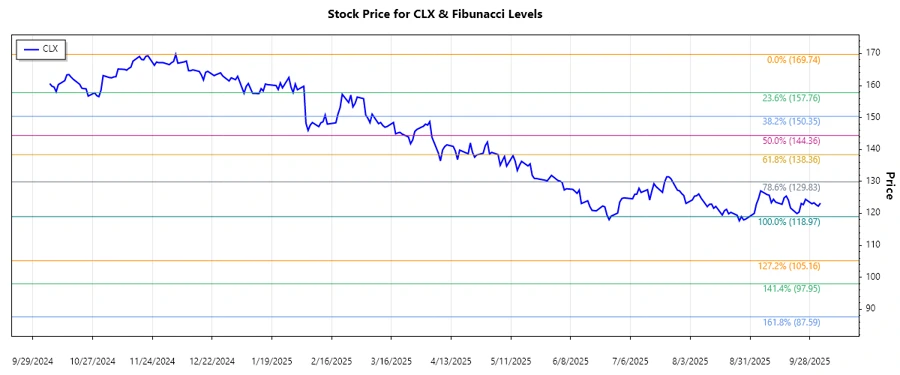
The Clorox Company stock has experienced fluctuations over the past months. The analysis recognizes the overall trend to be downward, suggesting potential caution for investors. Monitoring Fibonacci levels can provide insights into potential support areas, pivotal for strategic buying or selling decisions.
Fibonacci Analysis
| Start Date | End Date | High Price | High Date | Low Price | Low Date |
|---|---|---|---|---|---|
| 2024-12-09 | 2025-10-03 | 169.74 | 2024-12-05 | 118.97 | 2025-08-27 |
Fibonacci Levels
| Level | Price |
|---|---|
| 0.236 | 133.43 |
| 0.382 | 141.38 |
| 0.5 | 144.36 |
| 0.618 | 147.34 |
| 0.786 | 152.17 |
As of the current closing price of $123.19, the CLX stock is below the Fibonacci retracement levels, indicating a potential opportunity for support in the .236 region if prices move upward. Technically, a breach of this level could imply a reversal or further downtrend, but it is pivotal to discern price action around this mark.
Conclusion
The Clorox Company's stock presents a selling pressure evidenced by the downward trend over the past months. Fibonacci levels propose strategic price points to watch for potential reversals or continued trends. For analysts, key opportunities lie in identifying support or resistance within these levels as indicators for potential investment strategies. Given the trend, close monitoring for trend confirmation and market condition evaluation remains critical. Strong levels around 133.43 (0.236) could provide initial resistance.
Smart Data Insight
Master the Perfect Entry & Exit for this Stock
Don't leave your profits to chance. Historically, this stock follows specific seasonal patterns that institutional traders use to maximize returns.
- ✅ Identify the "Golden Buying Window"
- ✅ Avoid high-risk correction cycles
- ✅ Backtested data from the last 20+ years