August 17, 2025 a 10:15 am

CLX: Fibonacci Analysis - The Clorox Company
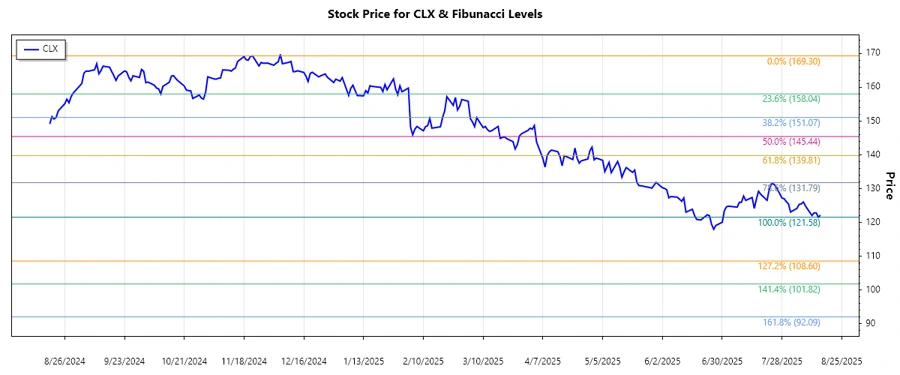
The Clorox Company (Ticker: CLX), a key player in the consumer products sector, has been experiencing a notable downtrend based on recent price data. Over the past few months, the stock has shown a significant decline, presenting potential opportunities for traders and investors analyzing retracement levels for strategic entry or exit points. Attention to technical indicators, such as Fibonacci levels, may provide insights into potential support or resistance areas within this trend.
Fibonacci Analysis
| Trend Analysis | Details |
|---|---|
| Start Date | 2024-11-22 |
| End Date | 2025-08-14 |
| High Point (Date) | 2024-11-22 (169.3) |
| Low Point (Date) | 2025-08-14 (121.58) |
Fibonacci Retracement Levels
| Level | Price Level |
|---|---|
| 0.236 | 132.41 |
| 0.382 | 140.18 |
| 0.5 | 145.44 |
| 0.618 | 150.70 |
| 0.786 | 158.72 |
The current price of CLX, as of 2025-08-14, is 121.58, which is below the 0.236 retracement level. This suggests the price is not currently in a retracement zone, indicating continued bearish sentiment. The key areas to watch are the Fibonacci levels, serving as potential resistance points if the price begins to recover.
Conclusion
The analysis of CLX reveals a sustained downtrend, with critical Fibonacci levels acting as focal points for potential resistance. In this bear market stretch, traders may find limited upside potential unless a reversal pattern emerges. Monitoring these retracement levels could provide opportunities for entering short positions or preparing for possible market rebounds. It's vital to stay updated on company fundamentals and broader market conditions, as these factors could influence the stock's performance and technical setups further.
Smart Data Insight
Master the Perfect Entry & Exit for this Stock
Don't leave your profits to chance. Historically, this stock follows specific seasonal patterns that institutional traders use to maximize returns.
- ✅ Identify the "Golden Buying Window"
- ✅ Avoid high-risk correction cycles
- ✅ Backtested data from the last 20+ years