
June 19, 2026 a 03:31 am
CLX: Dividend Analysis - The Clorox Company
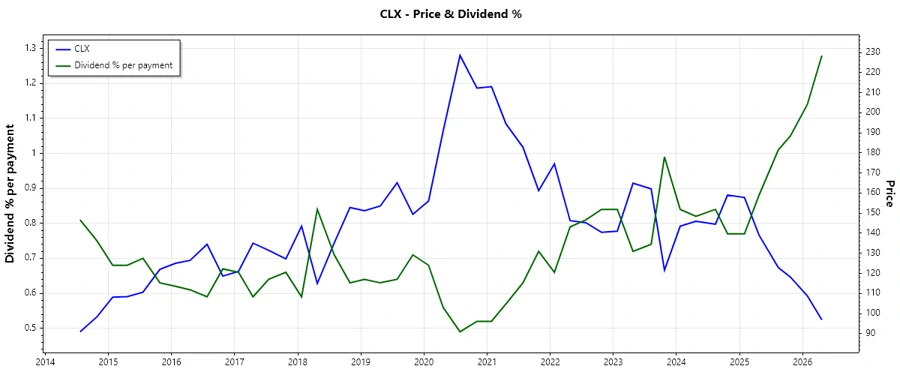
The Clorox Company, with a commendable dividend history spanning 45 years, showcases a robust yield of 5.12%. Despite challenges, its consistent dividend increments reflect sustained shareholder value creation. The absence of recent cuts further strengthens its dividend reliability. However, the high payout ratios necessitate scrutiny toward financial sustainability. Stability in cash flows and capital efficiency are crucial as the company navigates market uncertainties.
📊 Overview
Clorox, a key player in the consumer goods sector, offers an attractive dividend yield, showcasing its commitment to returning capital to shareholders. This section provides crucial insights into its dividend profile.
| Metric | Details |
|---|---|
| Sector | Consumer Goods |
| Dividend Yield | 5.12% |
| Current Dividend Per Share | $4.87 USD |
| Dividend History | 45 years |
| Last Cut or Suspension | None |
🗣️ Dividend History
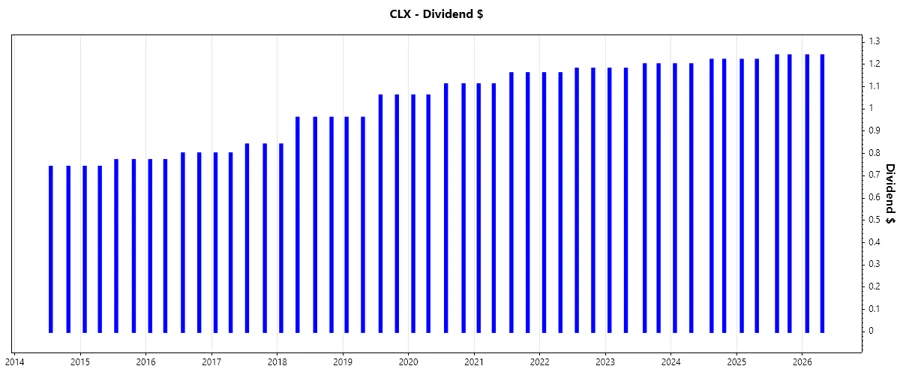
Understanding Clorox’s dividend history is crucial as it reflects the company's commitment and capability to consistently provide returns to shareholders. Its 45-year tradition of unbroken dividend payments underscores its financial resilience and reliability.
| Year | Dividend Per Share |
|---|---|
| 2026 | $2.48 |
| 2025 | $4.92 |
| 2024 | $4.84 |
| 2023 | $4.76 |
| 2022 | $4.68 |
📈 Dividend Growth
The dividend growth metric signifies the rate at which a company’s dividend has increased over time. These rates are fundamental for investors seeking growing income from their investments.
| Timeframe | Growth |
|---|---|
| 3 years | 1.68% |
| 5 years | 2.54% |
The average dividend growth is 2.54% over 5 years. This shows moderate but steady dividend growth.
⚠️ Payout Ratio
The payout ratio is a paramount indicator assessing the sustainability of dividends. Elevated levels, notably EPS-based at 78.24% and FCF-based at 155.08%, could signal potential stress under adverse conditions.
| Key Figure | Ratio |
|---|---|
| EPS-based | 78.24% |
| Free Cash Flow-based | 155.08% |
The current payout ratios highlight a potential risk of overextending resources, especially the FCF-based ratio, which exceeds 100%.
💼 Cashflow & Capital Efficiency
Assessing a company's cashflow and capital efficiency provides insights into its ability to fund capital expenditures, dividends, and share buybacks while sustaining growth.
| Year | 2025 | 2024 | 2023 |
|---|---|---|---|
| Free Cash Flow Yield | 5.13% | 2.90% | 4.73% |
| Earnings Yield | 5.46% | 1.68% | 0.76% |
| CAPEX to Operating Cash Flow | 22.43% | 30.50% | 19.69% |
| Stock-based Compensation to Revenue | 1.14% | 1.04% | 0.99% |
| Free Cash Flow to Operating Cash Flow Ratio | 77.57% | 69.50% | 80.31% |
Although efficiencies in capital allocation appear mixed, maintaining consistent free cash flow generation remains crucial for long-term sustainability.
🏦 Balance Sheet & Leverage Analysis
Analyzing leverage and liquidity provides an understanding of the financial stability and risk exposure of a company.
| Year | 2025 | 2024 | 2023 |
|---|---|---|---|
| Debt-to-Equity | 897.20% | 885.06% | 1329.09% |
| Debt-to-Assets | 51.79% | 50.48% | 49.18% |
| Debt-to-Capital | 89.97% | 89.85% | 93.00% |
| Net Debt to EBITDA | 1.96 | 3.73 | 4.53 |
| Current Ratio | 0.84 | 1.03 | 0.95 |
| Quick Ratio | 0.57 | 0.63 | 0.59 |
| Financial Leverage | 17.32 | 17.53 | 27.02 |
High leverage ratios reflect financial vulnerability, highlighting the need for strategic debt management to maintain balance sheet integrity.
📈 Fundamental Strength & Profitability
Examine profitability metrics as indicators of the company's efficiency in generating returns and managing operating expenses, which are pivotal for its market competitiveness.
| Year | 2025 | 2024 | 2023 |
|---|---|---|---|
| Return on Equity | 2.52% | 0.85% | 0.68% |
| Return on Assets | 14.57% | 4.87% | 2.51% |
| Net Margin | 11.40% | 3.95% | 2.02% |
| EBIT Margin | 16.41% | 6.88% | 4.44% |
| EBITDA Margin | 19.50% | 10.19% | 7.63% |
| Gross Margin | 45.23% | 42.97% | 39.36% |
| Research & Development to Revenue | 1.70% | 1.78% | 1.87% |
Sustained profitability and margin improvement are pivotal. Challenges persist in translating operational strength into consistent earnings.
📉 Price Development
✅ Dividend Scoring System
| Category | Score | Indicator |
|---|---|---|
| Dividend Yield | 5 | |
| Dividend Stability | 5 | |
| Dividend Growth | 3 | |
| Payout Ratio | 2 | |
| Financial Stability | 3 | |
| Dividend Continuity | 5 | |
| Cashflow Coverage | 3 | |
| Balance Sheet Quality | 2 |
Total Score: 28/40
🗣️ Rating
The Clorox Company demonstrates a strong historical commitment to dividend payments and yield. However, elevated payout ratios and leverage warrant cautious optimism. Investors are advised to monitor sustainability measures and financial health closely, considering further diversification for safety.
Smart Data Insight
Master the Perfect Entry & Exit for this Stock
Don't leave your profits to chance. Historically, this stock follows specific seasonal patterns that institutional traders use to maximize returns.
- ✅ Identify the "Golden Buying Window"
- ✅ Avoid high-risk correction cycles
- ✅ Backtested data from the last 20+ years