October 02, 2025 a 07:47 am
CLX: Dividend Analysis - The Clorox Company
The Clorox Company presents a significant opportunity for income-focused investors. With a robust dividend history spanning 44 years, Clorox is considered a reliable dividend-payer in the consumer staples sector. Despite moderate growth, its consistent dividends make it a staple for conservative portfolios. Clorox's prudent payout ratios and solid balance sheet position it well for sustained future payouts.
📊 Overview
The Clorox Company operates within the consumer staples sector, offering a stable and reliable dividend yield. Below is a comprehensive overview of its dividend profile:
| Parameter | Details |
|---|---|
| Sector | Consumer Staples |
| Dividend Yield | 4.01% |
| Current Dividend per Share | $4.87 |
| Dividend History | 44 years |
| Last Cut or Suspension | None |
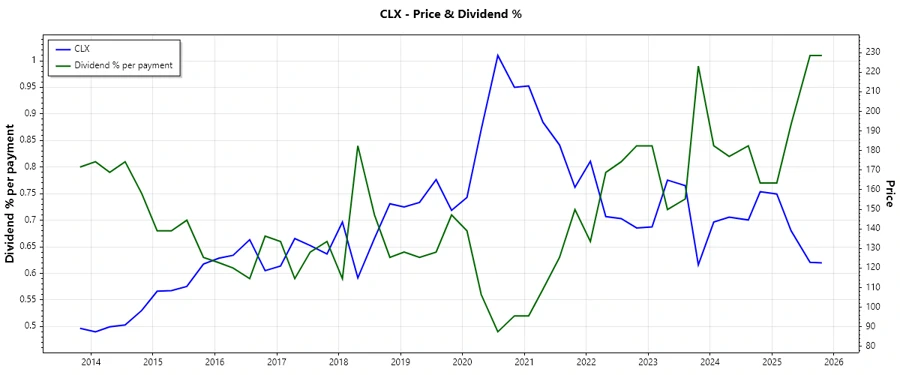
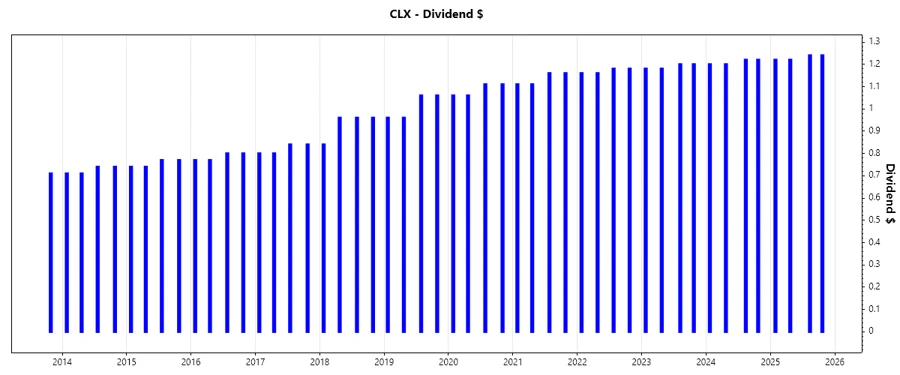
📈 Dividend History
The longstanding history of increasing dividends is a testament to Clorox's commitment to returning value to its shareholders. Such a history is a reassuring indicator of financial health and resilience.
| Year | Dividend per Share (USD) |
|---|---|
| 2025 | 4.92 |
| 2024 | 4.84 |
| 2023 | 4.76 |
| 2022 | 4.68 |
| 2021 | 4.54 |
📈 Dividend Growth
Understanding the dividend growth rate helps investors discern the company's commitment to increasing shareholder returns over time:
| Time | Growth |
|---|---|
| 3 years | 2.16% |
| 5 years | 3.68% |
The average dividend growth is 3.68% over 5 years. This shows moderate but steady dividend growth.
🗣️ Payout Ratio
The payout ratio is critical for determining dividend sustainability. Clorox's payout ratios suggest careful and sustainable dividend management.
| Key figure | Ratio |
|---|---|
| EPS-based | 74.11% |
| Free cash flow-based | 78.33% |
With an EPS payout ratio of 74.11% and an FCF payout ratio of 78.33%, Clorox maintains a balanced approach to its dividend distribution, ensuring it is both rewarding and sustainable.
📉 Cashflow & Capital Efficiency
Assessing cash flow and capital efficiency is crucial to verify the sustainability of dividend payments:
| Metric | 2025 | 2024 | 2023 |
|---|---|---|---|
| Free Cash Flow Yield | 5.13% | 2.90% | 4.73% |
| Earnings Yield | 5.46% | 1.68% | 0.76% |
| CAPEX to Operating Cash Flow | 22.43% | 30.50% | 19.69% |
| Stock-based Compensation to Revenue | 1.14% | 1.04% | 0.99% |
| Free Cash Flow / Operating Cash Flow Ratio | 77.57% | 69.50% | 80.31% |
Consistent cash flows and efficient capital management indicate strong dividend coverage and potential for future increases.
📝 Balance Sheet & Leverage Analysis
Monitoring leverage and liquidity is essential for assessing the company's financial health and risks related to debt.
| Metric | 2025 | 2024 | 2023 |
|---|---|---|---|
| Debt-to-Equity Ratio | 897.20% | 885.06% | 1329.09% |
| Debt-to-Assets Ratio | 51.79% | 50.48% | 49.18% |
| Debt-to-Capital Ratio | 89.97% | 89.85% | 93.00% |
| Net Debt to EBITDA | 2.33 | 3.67 | 4.43 |
| Current Ratio | 0.84 | 0.00 | 0.00 |
| Quick Ratio | 0.57 | 0.63 | 0.59 |
High leverage ratios suggest a significant reliance on debt, necessitating careful monitoring of Clorox's debt management strategy.
✅ Fundamental Strength & Profitability
These metrics provide insights into the company's operating efficiency and profitability, integral for sustainable dividend growth.
| Metric | 2025 | 2024 | 2023 |
|---|---|---|---|
| Return on Equity | 2.52% | 0.85% | 0.68% |
| Return on Assets | 14.57% | 4.87% | 2.51% |
| Margins (Net) | 11.40% | 3.95% | 2.02% |
While return figures indicate current challenges, Clorox's profitability metrics remain stable, supporting its dividend viability.
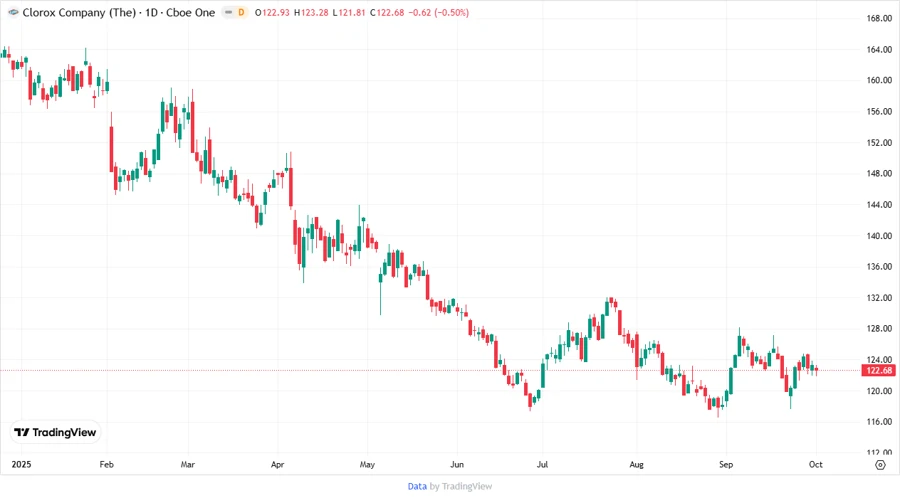
📉 Price Development
🗣️ Dividend Scoring System
| Criterion | Score | Rating |
|---|---|---|
| Dividend Yield | 4 | |
| Dividend Stability | 5 | |
| Dividend Growth | 3 | |
| Payout Ratio | 4 | |
| Financial Stability | 3 | |
| Dividend Continuity | 5 | |
| Cashflow Coverage | 4 | |
| Balance Sheet Quality | 3 |
Overall Score: 31/40
📈 Rating
In conclusion, The Clorox Company is rated as a moderately attractive dividend stock, suitable for conservative investors seeking steady income. Its comprehensive dividend strategy is supported by historical consistency, prudent payout ratios, and strategic financial management, but its high leverage warrants prudent monitoring.
Smart Data Insight
Master the Perfect Entry & Exit for this Stock
Don't leave your profits to chance. Historically, this stock follows specific seasonal patterns that institutional traders use to maximize returns.
- ✅ Identify the "Golden Buying Window"
- ✅ Avoid high-risk correction cycles
- ✅ Backtested data from the last 20+ years