August 05, 2025 a 07:46 am
CLX: Dividend Analysis - The Clorox Company
The Clorox Company is a stable dividend payer with a strong yield of 3.95% and a history of 44 consecutive years of dividend payments. While recent modest growth suggests consistency, the high payout ratios necessitate cautious optimism for future increments. The company's commitment to shareholder returns is evident, but the financial leverage poses questions on the sustainability of its payouts.
📊 Overview
The Clorox Company operates in a resilient sector, ensuring a degree of financial stability. With a dividend yield of 3.95%, investors are rewarded with an attractive income stream. A current dividend per share of $4.88 points to consistent returns, supported by a robust dividend history spanning 44 years without any cuts.
| Metric | Details |
|---|---|
| Sector | Consumer Goods |
| Dividend Yield | 3.95% |
| Current Dividend Per Share | $4.88 |
| Dividend History | 44 years |
| Last Cut or Suspension | None |
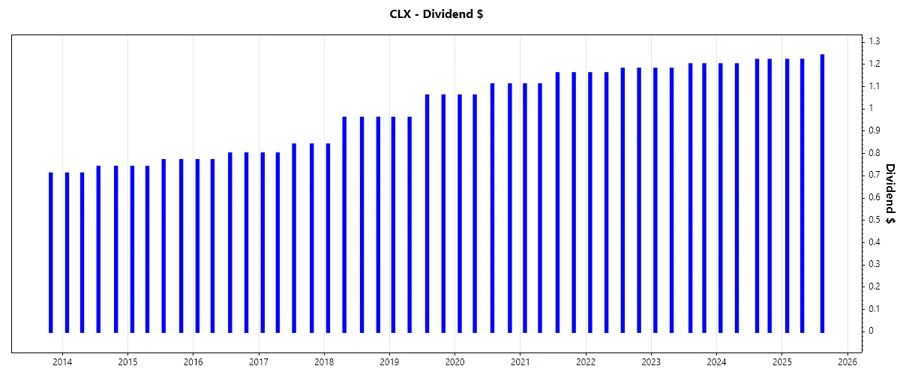
📉 Dividend History
A consistent dividend history is a testament to a company's reliability in returning value to shareholders. Clorox's 44-year streak of uninterrupted dividends enhances its reputation as a conservative yet dependable pick. Such tenure underscores its ability to generate cash flow, even in challenging market conditions.
| Year | Dividend Per Share (USD) |
|---|---|
| 2025 | $3.68 |
| 2024 | $4.84 |
| 2023 | $4.76 |
| 2022 | $4.68 |
| 2021 | $4.54 |
📈 Dividend Growth
Growth in dividends is a key factor for enhancing long-term investment returns. Over the past 3 years, Clorox has exhibited a dividend growth rate of 2.16%, and over 5 years, a rate of 3.68%. This moderate growth trajectory suggests a stable yet cautious approach to increasing shareholder value, indicative of Clorox's strategy amidst competitive markets.
| Time | Growth |
|---|---|
| 3 years | 2.16% |
| 5 years | 3.68% |
The average dividend growth is 3.68% over 5 years. This shows moderate but steady dividend growth.
🗣️ Payout Ratio
The payout ratio is an essential indicator of the dividend's sustainability. Clorox's EPS-based payout ratio stands at 74.21%, while the free cash flow-based is slightly higher at 75.09%. Such figures suggest that while dividends are well covered, the slight edge near 100% could potentially limit future hikes without significant profit increases.
| Key Figure | Ratio |
|---|---|
| EPS-based | 74.21% |
| Free cash flow-based | 75.09% |
High payout ratios close to 100% indicate limited room for further growth without impacting financial flexibility. Attention is needed on cost management to sustain dividend increments.
✅ Cashflow & Capital Efficiency
Cash flow is the lifeblood of sustained dividend distributions. Clorox demonstrates efficiency in converting revenue into free cash flow with a 5.23% yield. However, a significant portion is utilized for CAPEX, limiting reinvestment opportunities elsewhere.
| Year | 2023 | 2024 | 2025 |
|---|---|---|---|
| Free Cash Flow Yield | 4.73% | 2.90% | - |
| Earnings Yield | 0.76% | 1.68% | 5.46% |
| CAPEX to Operating Cash Flow | 19.69% | 30.50% | - |
| Stock-based Compensation to Revenue | 0.99% | - | - |
| Free Cash Flow/Operating Cash Flow Ratio | 80.31% | 69.50% | - |
Overall, the efficiency in cash flow generation supports dividend viability, yet the allocation of cash must be balanced to ensure retention capabilities for future growth.
⚠️ Balance Sheet & Leverage Analysis
The company's leverage ratios are indicative of its debt management strategy. Net debt to EBITDA metrics suggest manageable levels for Clorox, with a current ratio below the threshold suggesting tighter short-term liquidity.
| Year | 2023 | 2024 | 2025 |
|---|---|---|---|
| Debt-to-Equity | 13.29 | 8.85 | - |
| Debt-to-Assets | 49.18% | 50.48% | - |
| Debt-to-Capital | 93.00% | 89.85% | - |
| Net Debt to EBITDA | 4.43 | 3.67 | - |
| Current Ratio | 0.954 | 1.031 | - |
| Quick Ratio | 0.591 | 0.626 | - |
Clorox shows prudent financial leveraging but requires safeguarding of its liquidity to ensure operational flexibility.
📊 Fundamental Strength & Profitability
Financial metrics for Clorox exhibit strengths in gross margin and return indicators, crucial for maintaining profitability and trust of the investment community.
| Year | 2023 | 2024 | 2025 |
|---|---|---|---|
| Return on Equity | 67.73% | 85.37% | - |
| Return on Assets | 2.51% | 4.87% | - |
| Net Margin | 2.02% | 3.95% | 11.40% |
| Gross Margin | 39.36% | 42.97% | 45.23% |
| Research & Development to Revenue | 1.87% | 1.78% | 1.70% |
The company's robust profitability ratios reinforce confidence, with net margin improvements highlighting operational efficiency gains over time.
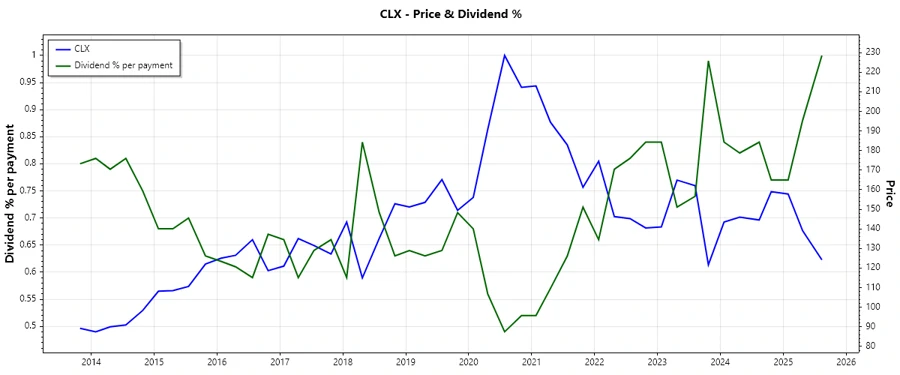
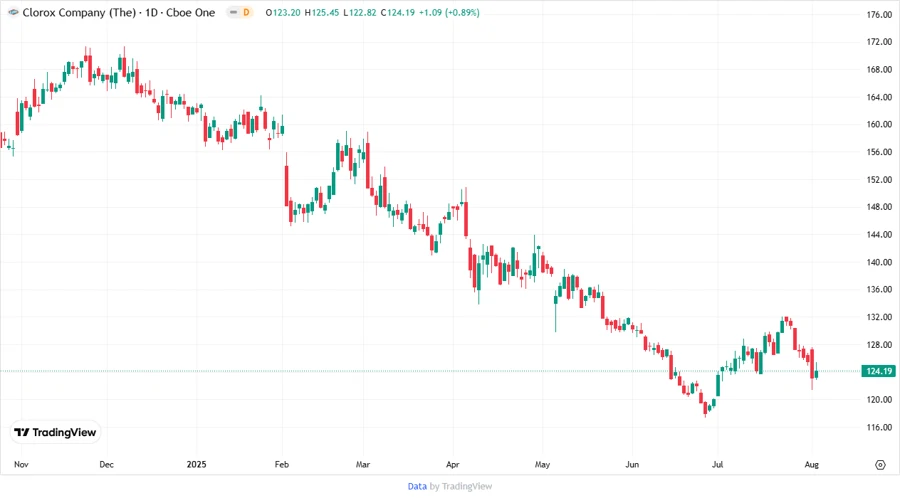
📈 Price Development
✅ Dividend Scoring System
An evaluation based on several financial metrics crucial to dividend investors.
| Criteria | Score | Bar |
|---|---|---|
| Dividend Yield | 4/5 | |
| Dividend Stability | 5/5 | |
| Dividend Growth | 3/5 | |
| Payout Ratio | 3/5 | |
| Financial Stability | 4/5 | |
| Dividend Continuity | 5/5 | |
| Cashflow Coverage | 4/5 | |
| Balance Sheet Quality | 3/5 |
Total Score: 31/40
Rating
The Clorox Company offers a compelling investment case for dividend-seeking investors, with a notable yield and historical consistency. However, its financial metrics reveal a tightly managed dividend policy, suggesting the need for vigilance on fiscal strategies and investments in growth sectors. Overall, Clorox is recommended for conservative investors prioritizing income stability over aggressive growth potential.
Smart Data Insight
Master the Perfect Entry & Exit for this Stock
Don't leave your profits to chance. Historically, this stock follows specific seasonal patterns that institutional traders use to maximize returns.
- ✅ Identify the "Golden Buying Window"
- ✅ Avoid high-risk correction cycles
- ✅ Backtested data from the last 20+ years