July 17, 2025 a 03:32 pm
CLX: Dividend Analysis - The Clorox Company
The Clorox Company, with its long-standing dividend history of 44 years and a current dividend yield of 4.37%, continues to present itself as a steady choice for income-seeking investors. Despite the high payout ratio, the consistent dividend growth over 5 years reassures its commitment to stakeholders. Nonetheless, attention should be paid to its leverage ratios which might impact long-term sustainability.
📊 Overview
The Clorox Company operates in the Consumer Goods sector and displays a commendable dividend profile that might attract conservative investors. Its dividend history of 44 years further solidifies its reputation as a reliable income stock.
| Parameter | Value |
|---|---|
| Sector | Consumer Goods |
| Dividend yield | 4.37 % |
| Current dividend per share | 4.79 USD |
| Dividend history | 44 years |
| Last cut or suspension | None |
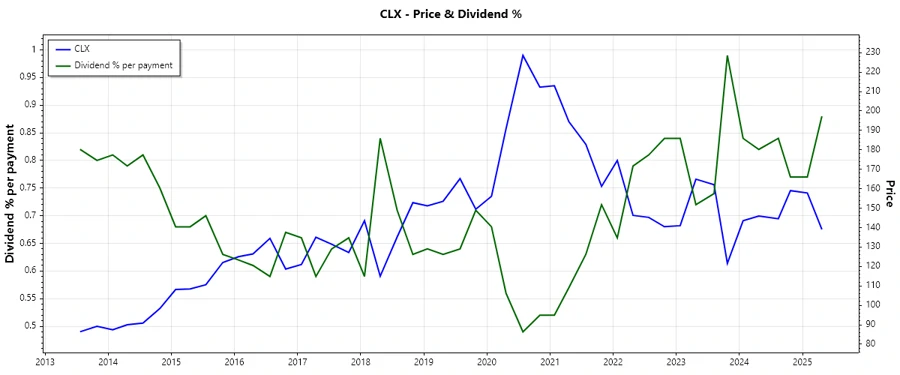
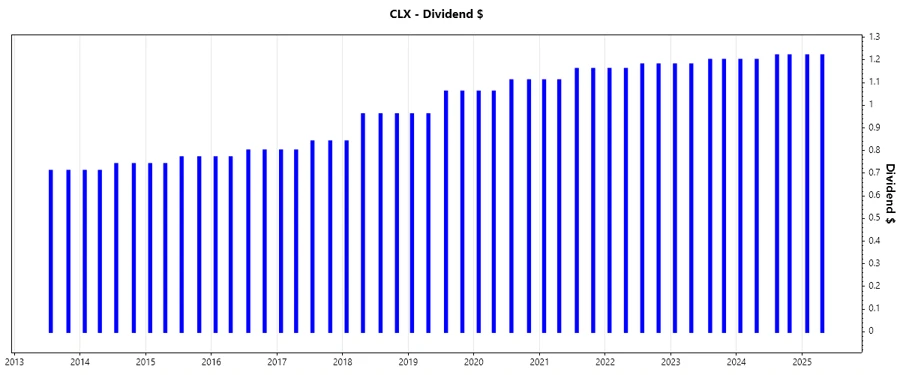
📈 Dividend History
An impressive uninterrupted dividend history is indicative of the company's robust cash generation capabilities. Ensuring a dividend track record helps in gaining investor confidence and reflects on the company's consistent growth potential.
| Year | Dividend Per Share (USD) |
|---|---|
| 2025 | 2.44 |
| 2024 | 4.84 |
| 2023 | 4.76 |
| 2022 | 4.68 |
| 2021 | 4.54 |
📉 Dividend Growth
The sustainable growth in dividends illustrates a company's ability to enhance investor returns over time, crucial for maintaining purchasing power against inflation.
| Time | Growth |
|---|---|
| 3 years | 2.16 % |
| 5 years | 3.68 % |
The average dividend growth is 3.68% over 5 years. This shows moderate but steady dividend growth.
✅ Payout Ratio
The payout ratio is an essential measure for determining the sustainability of a company's dividend payments. It indicates what proportion of earnings or cash flows are being returned to shareholders as dividends.
| Key figure ratio | Value |
|---|---|
| EPS-based | 85.18 % |
| Free cash flow-based | 73.73 % |
An EPS-based payout ratio of 85.18% is quite high, indicating that a large portion of earnings is distributed as dividends. The FCF-based ratio of 73.73% suggests prudent cash flow management, but ongoing vigilance is advisable.
📊 Cashflow & Capital Efficiency
Cashflow management and capital efficiency are paramount to sustaining dividends and funding growth opportunities. They provide insights into the organization's financial resilience and operational productivity.
| Metric | 2024 | 2023 | 2022 |
|---|---|---|---|
| Free Cash Flow Yield | 2.90% | 4.73% | 3.08% |
| Earnings Yield | 1.68% | 0.76% | 2.66% |
| CAPEX to OCF | 30.50% | 19.69% | 31.93% |
| Stock-based Compensation to Revenue | 0 % | 0.99 % | 0.73 % |
| FCF / OCF Ratio | 69.50% | 80.31% | 68.07% |
The higher cash flow coverage ratios suggest good cash flow stability, while efficient capital allocations support longer-term value creation. However, balanced caution regarding leverage is warranted.
🔍 Balance Sheet & Leverage Analysis
Understanding a company's balance sheet is fundamental in appraising its financial soundness and leverage. It reveals the ability to meet obligations and invest in growth without excessive financial risk.
| Metric | 2024 | 2023 | 2022 |
|---|---|---|---|
| Debt-to-Equity | 885.06% | 1329.09% | 558.09% |
| Debt-to-Assets | 50.48% | 49.18% | 50.39% |
| Debt-to-Capital | 89.85% | 93% | 84.80% |
| Net Debt to EBITDA | 3.67 | 4.43 | 3.15 |
| Current Ratio | 1.03 | 0.95 | 0.97 |
| Quick Ratio | 0.63 | 0.59 | 0.54 |
While the company faces high leverage ratios, the stable quick and current ratios imply sufficient liquidity to cover short-term liabilities. Yet, balancing leverage reduction will be crucial to financial robustness.
📈 Fundamental Strength & Profitability
Fundamentals and profitability metrics are key indicators of corporate efficiency and long-term economic moat. They signal operational effectiveness and capacity for future profitability enhancement.
| Metric | 2024 | 2023 | 2022 |
|---|---|---|---|
| Return on Equity | 85.37% | 67.73% | 83.09% |
| Return on Assets | 4.87% | 2.51% | 7.50% |
| Net Margin | 3.95% | 2.02% | 6.50% |
| EBIT Margin | 6.88% | 4.44% | 10.03% |
| EBITDA Margin | 10.38% | 7.81% | 13.06% |
| Gross Margin | 42.97% | 39.36% | 35.81% |
The fundamental strengths imply effective cost management and robust earnings potential; however, maintaining these margins amidst high leverage will require strategic foresight.
🔍 Dividend Scoring System
| Criteria | Score (1-5) | |
|---|---|---|
| Dividend yield | 4 | |
| Dividend Stability | 5 | |
| Dividend growth | 3 | |
| Payout ratio | 3 | |
| Financial stability | 2 | |
| Dividend continuity | 5 | |
| Cashflow Coverage | 3 | |
| Balance Sheet Quality | 2 |
Total Score: 27/40
🗣️ Rating
In conclusion, The Clorox Company's dividends are underpinned by a consistent track record, providing reassurance to long-term income investors. However, high leverage and moderate balance sheet constraints suggest a cautious stance for prospective investors looking for assured financial stability and growth prospects.