September 08, 2025 a 04:03 am


CI: Trend and Support & Resistance Analysis - The Cigna Group
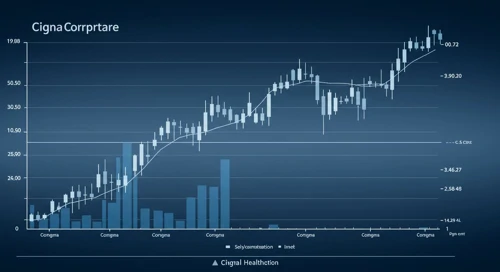
The Cigna Group (Ticker: CI) has exhibited varied performance over the past few months. With a diverse range of insurance and health services, the company's stock reflects broader market trends and internal strategic maneuvers. Recent price movements indicate a potential shifting trend which investors should closely monitor. The current analysis indicates a moderate risk environment with both opportunities and challenges in navigating this health service giant's stock activities.
Trend Analysis
Based on the closing prices and calculated EMAs (Exponential Moving Averages), The Cigna Group's stock has shown significant fluctuations. Here's a brief overview of the trendism:
| Date | Close Price | Trend |
|---|---|---|
| 2025-09-05 | $305.31 | ▲ |
| 2025-09-04 | $304.03 | ▲ |
| 2025-09-03 | $300.48 | ▲ |
| 2025-09-02 | $300.72 | ▲ |
| 2025-08-29 | $300.87 | ▲ |
| 2025-08-28 | $299.00 | ▼ |
| 2025-08-27 | $299.95 | ▼ |
The calculated EMAs indicate a predominating upward trend as the EMA20 is consistently greater than the EMA50. This is indicative of potential strength in the stock's movement. Critical analysis must focus on the sustainability of this trend in light of market conditions and company performance.
Support and Resistance
Identifying support and resistance levels based on recent closing prices helps gauge potential reversal points:
| Type | Zone From | Zone To |
|---|---|---|
| Support Zone 1 | $290.00 | $295.00 |
| Support Zone 2 | $270.00 | $275.00 |
| Resistance Zone 1 | $310.00 | $315.00 |
| Resistance Zone 2 | $320.00 | $325.00 |
Currently, the price is hovering near the Resistance Zone 1, suggesting that if the stock breaks this level, it may experience a stronger bullish momentum. However, should the price retrace, touching support zones could provide buying opportunities.
Conclusion
The Cigna Group's stock displays upward moving indicators, possibly reflecting the company's recent strategic moves and market dynamics. The proximity to resistance levels suggests vigilance for bullish continuations or potential reversals. Analysts need to monitor financial reports, changes in the healthcare sector, and broader economic indicators to assess the viability of sustained growth. Risk assessment should consider external market factors, regulatory changes, and performance metrics within Cigna's service segments.
Smart Data Insight
Master the Perfect Entry & Exit for this Stock
Don't leave your profits to chance. Historically, this stock follows specific seasonal patterns that institutional traders use to maximize returns.
- ✅ Identify the "Golden Buying Window"
- ✅ Avoid high-risk correction cycles
- ✅ Backtested data from the last 20+ years