
June 15, 2026 a 07:43 pm
CI: Fundamental Ratio Analysis - Cigna Corporation
Cigna Corporation operates within the healthcare sector, providing a robust range of insurance and health services. Known for its diversified business model and stable revenue generation, the company is well-positioned in the insurance market. However, like any company operating in a highly regulated environment, Cigna faces regulatory risks.
Fundamental Rating
The fundamental metrics for Cigna show a moderately positive outlook. The company reveals strong potential in its earnings power and profitability metrics but is adversely affected by debt levels.
| Category | Score | Visual |
|---|---|---|
| Discounted Cash Flow | 5 | |
| Return on Equity | 4 | |
| Return on Assets | 4 | |
| Debt to Equity | 1 | |
| Price to Earnings | 2 | |
| Price to Book | 3 |
Historical Rating
Analyzing the historical scores, there is consistency in Cigna's performance over time.
| Date | Overall | DCF | ROE | ROA | D/E | P/E | P/B |
|---|---|---|---|---|---|---|---|
| 2026-06-15 | 3 | 5 | 4 | 4 | 1 | 2 | 3 |
| N/A | 0 | 5 | 4 | 4 | 1 | 2 | 3 |
Analyst Price Targets
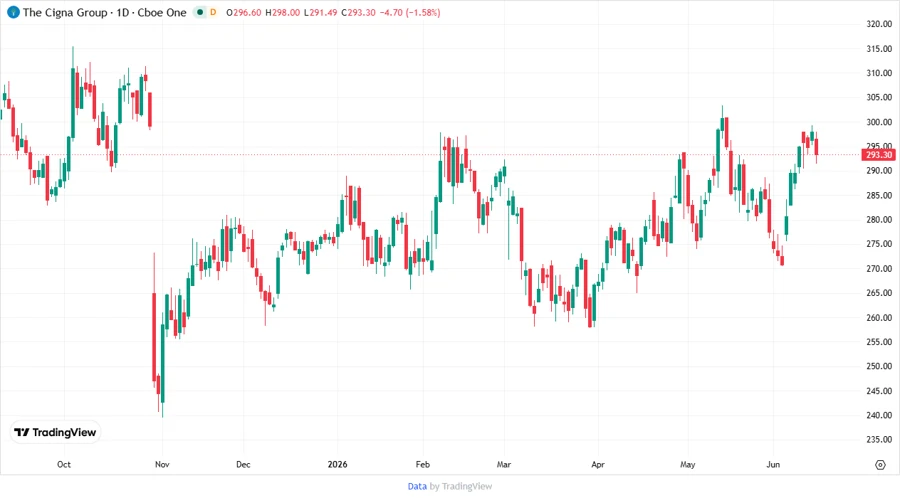
Analyst price targets suggest moderate growth. Current estimates highlight an attractive range, encouraging investment interest.
| High | Low | Median | Consensus |
|---|---|---|---|
| $400 | $302 | $340 | $343.5 |
Analyst Sentiment
The consensus among analysts is positive, with a strong disposition towards 'Buy' recommendations.
| Recommendation | Count | Visual |
|---|---|---|
| Strong Buy | 1 | |
| Buy | 29 | |
| Hold | 9 | |
| Sell | 0 | |
| Strong Sell | 0 |
Conclusion
Cigna Corporation, rooted deeply in the healthcare sector, exhibits stability in its core financial metrics, making it a reliable choice for long-term investors. With a favorable analyst consensus and robust analyst price targets, it promises an attractive investment opportunity. However, potential investors should be mindful of the company's debt levels and the heavily regulated nature of its industry. Overall, Cigna remains a compelling option for those seeking steady growth in the healthcare insurance domain.
Smart Data Insight
Master the Perfect Entry & Exit for this Stock
Don't leave your profits to chance. Historically, this stock follows specific seasonal patterns that institutional traders use to maximize returns.
- ✅ Identify the "Golden Buying Window"
- ✅ Avoid high-risk correction cycles
- ✅ Backtested data from the last 20+ years