August 24, 2025 a 10:15 am
CI: Fibonacci Analysis - The Cigna Group
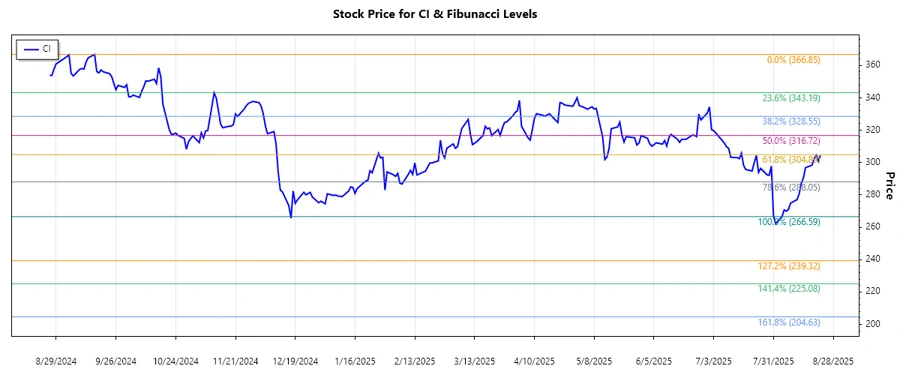
The Cigna Group has been navigating a challenging environment in the insurance sector. The stock has recently shown a strong bearish trend, reflecting broader market influences as well as sector-specific challenges such as regulatory changes and competitive pressures. This analysis focuses on the recent predominant downward trend and explores potential retracement levels where the price might find support.
Fibonacci Analysis
| Aspect | Details |
|---|---|
| Trend Start Date | 2024-09-16 |
| Trend End Date | 2025-08-22 |
| High Point | $366.85 on 2024-09-16 |
| Low Point | $266.59 on 2025-08-04 |
| Fibonacci Levels |
|
| Current Price | $304.35 |
| Retracement Zone | The current price is in the 0.382 retracement zone. |
| Interpretation | The stock is encountering resistance around the 0.382 level, indicating potential selling pressure. A break above this level might suggest a shift in momentum. |
Conclusion
In summary, The Cigna Group's stock is currently navigating a significant bearish trend, with a substantial decrease in price over the past year. The recent interaction with the Fibonacci level at 0.382 indicates potential resistance, which could lead to further declines if not breached. However, if the stock breaks above this level, it could signal a technical rebound that might attract short-term traders. Long-term investors should remain cautious, considering both market conditions and sector-specific factors. Analysts might view the current levels as potential entry points if supporting indicators suggest a bullish reversal, otherwise, further monitoring is advised.
Smart Data Insight
Master the Perfect Entry & Exit for this Stock
Don't leave your profits to chance. Historically, this stock follows specific seasonal patterns that institutional traders use to maximize returns.
- ✅ Identify the "Golden Buying Window"
- ✅ Avoid high-risk correction cycles
- ✅ Backtested data from the last 20+ years