August 06, 2025 a 03:31 am


CI: Dividend Analysis - The Cigna Group
The Cigna Group stands as a significant player in the sector with notable achievements in terms of dividend distribution and financial growth. The company's commitment to maintaining dividend payouts over the years reflects financial prudence and a shareholder-friendly approach. Despite economic uncertainties, its consistent dividend yield and growth indicate robust financial health and confidence in future earnings.
📊 Overview
The Cigna Group is a distinguished entity in the sector, characterized by a dividend yield of 2.19%. With a current dividend per share of USD 5.59, the company boasts a commendable dividend history spanning 44 years, with no recent cuts or suspensions.
| Metric | Value |
|---|---|
| Sector | Healthcare |
| Dividend Yield | 2.19% |
| Current Dividend Per Share | 5.59 USD |
| Dividend History | 44 years |
| Last Cut or Suspension | None |
🗣️ Dividend History
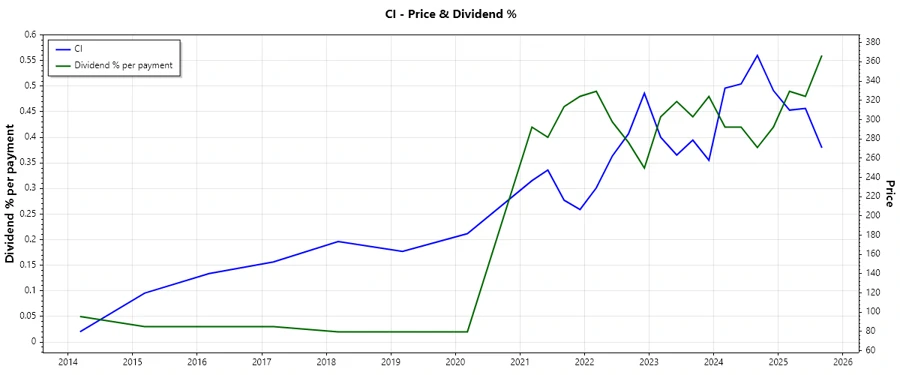
The dividend history underscores Cigna's long-standing commitment to rewarding shareholders. This long history is vital in building investor trust and showcasing financial resilience over market cycles. Below is a visual illustration of the company's recent dividend performance.
| Year | Dividend Per Share (USD) |
|---|---|
| 2025 | 4.53 |
| 2024 | 5.6 |
| 2023 | 4.92 |
| 2022 | 4.48 |
| 2021 | 4 |
📈 Dividend Growth
Understanding dividend growth is crucial for assessing the future potential of dividend payouts. The 5-year growth rate is 1.69%, indicating a steady increase over time, suggesting confidence in cash flow and earnings growth to support higher dividends.
| Time | Growth |
|---|---|
| 3 years | 11.87% |
| 5 years | 1.69% |
The average dividend growth is 1.69% over 5 years. This shows moderate but steady dividend growth.
⚠️ Payout Ratio
Payout ratios provide insights into the sustainability of a company’s dividend. A payout ratio of 43.47% based on EPS ensures the dividend is well-covered by earnings. Meanwhile, a 37.84% FCF-based payout ratio indicates a strong capacity to finance dividends from operating cash flows.
| Key figure | Ratio |
|---|---|
| EPS-based | 43.47% |
| Free cash flow-based | 37.84% |
These ratios suggest that Cigna's dividend payments are securely backed by both earnings and cash flows, indicating a low risk of dividend cuts.
✅ Cashflow & Capital Efficiency
The cashflow and capital efficiency metrics for Cigna Group highlight its capacity to generate cash relative to its capital investments. This understanding is pivotal in evaluating the firm’s ability to sustain operations and return capital to shareholders.
| Metric | 2024 | 2023 | 2022 |
|---|---|---|---|
| Free Cash Flow Yield | 11.57% | 11.52% | 7.10% |
| Earnings Yield | 4.44% | 5.81% | 6.46% |
| CAPEX to Operating Cash Flow | 13.57% | 13.32% | 14.96% |
| Stock-based Compensation to Revenue | 0.13% | 0.15% | 0.15% |
| Free Cash Flow / Operating Cash Flow Ratio | 86.43% | 86.68% | 85.03% |
Having stable cash flows ensures Cigna's ability to adequately fund its dividend policy and capital investments.
📝 Balance Sheet & Leverage Analysis
A comprehensive evaluation of the Cigna Group's balance sheet and leverage ratios is crucial for determining financial robustness and risk levels. Key metrics below exhibit the company's adept management of its capital structure.
| Metric | 2024 | 2023 | 2022 |
|---|---|---|---|
| Debt-to-Equity | 77.92% | 66.91% | 69.29% |
| Debt-to-Assets | 20.51% | 20.25% | 21.60% |
| Debt-to-Capital | 43.79% | 40.08% | 40.93% |
| Net Debt to EBITDA | 2.58 | 2.31 | 2.00 |
| Current Ratio | 84.28% | 76.67% | 267.37% |
| Quick Ratio | 72.75% | 76.67% | 223.00% |
| Financial Leverage | 3.80 | 3.30 | 3.21 |
Cigna exhibits financial stability with prudent debt management, ensuring liquidity and minimizing over-leverage risks.
📉 Fundamental Strength & Profitability
An analysis of Cigna's profitability and fundamental strength is essential for understanding its operational efficiency and value creation for shareholders.
| Metric | 2024 | 2023 | 2022 |
|---|---|---|---|
| Return on Equity | 8.37% | 11.17% | 14.94% |
| Return on Assets | 2.20% | 3.38% | 4.66% |
| Net Margin | 1.41% | 2.65% | 3.72% |
| EBIT Margin | 2.74% | 3.57% | 5.35% |
| EBITDA Margin | 3.88% | 5.12% | 6.98% |
| Gross Margin | 10.62% | N/A | 82.38% |
| R&D to Revenue | 0% | 0% | 0% |
With solid returns on equity and assets, Cigna demonstrates effective management and profitability independence of R&D investments.
📈 Price Development
📊 Dividend Scoring System
| Category | Score | Score Bar |
|---|---|---|
| Dividend yield | 3/5 | |
| Dividend Stability | 5/5 | |
| Dividend growth | 2/5 | |
| Payout ratio | 4/5 | |
| Financial stability | 4/5 | |
| Dividend continuity | 5/5 | |
| Cashflow Coverage | 4/5 | |
| Balance Sheet Quality | 4/5 |
Total Score: 35/40
🗣️ Rating
Cigna Group presents a solid dividend profile with consistent returns, although growth potential may be moderate. Its strong financial stability and reliable payout track record offer a compelling case for income-focused investors. The company is well-positioned to support its dividend policy, making it a prudent long-term investment for those seeking steady returns in the healthcare sector.
Smart Data Insight
Master the Perfect Entry & Exit for this Stock
Don't leave your profits to chance. Historically, this stock follows specific seasonal patterns that institutional traders use to maximize returns.
- ✅ Identify the "Golden Buying Window"
- ✅ Avoid high-risk correction cycles
- ✅ Backtested data from the last 20+ years