May 14, 2026 a 03:31 pm


CI: Dividend Analysis - Cigna Corporation
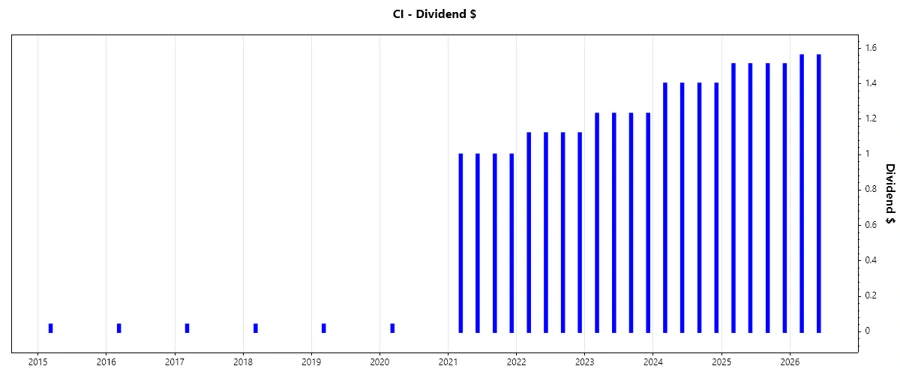
Cigna Corporation presents a stable dividend profile with a long history of consistency. The company has demonstrated its ability to maintain steady dividends over many years, with an impressive 45-year history of payouts. With a current dividend yield of approximately 2.07%, investors can expect consistent income. Cigna's prudent payout ratios ensure that dividends are well-covered, contributing to its appeal as a reliable income stock.
📊 Overview
Cigna stands out in the healthcare sector not only for its comprehensive services but also for maintaining a rewarding dividend policy. Its disciplined financial management ensures that dividends are a sustainable aspect of shareholder returns, providing a dependable source of income for investors.
| Category | Details |
|---|---|
| Sector | Healthcare |
| Dividend Yield | 2.07% |
| Current Dividend per Share | 6.06 USD |
| Dividend History | 45 years |
| Last Cut or Suspension | None |
📈 Dividend History
The extensive dividend history of Cigna Corporation signifies its strong commitment to rewarding shareholders. Regular dividend payments are indicative of financial health and company stability, making it an attractive option for income-seeking investors.
| Year | Dividend per Share (USD) |
|---|---|
| 2026 | 3.12 |
| 2025 | 6.04 |
| 2024 | 5.60 |
| 2023 | 4.92 |
| 2022 | 4.48 |
📉 Dividend Growth
Dividend growth is a key indicator of company strength, signaling potential future financial performance and the company's ability to increase returns to its shareholders. Cigna's moderate, steady growth demonstrates its systematic approach to enhancing shareholder value.
| Time | Growth |
|---|---|
| 3 years | 0.10% |
| 5 years | 1.73% |
The average dividend growth is 1.73% over 5 years. This shows moderate but steady dividend growth.
🗣️ Payout Ratio
Payout ratios are critical measures of dividend sustainability and company profitability. A lower payout ratio suggests that the company retains ample earnings to support future operations and dividends.
| Payout Ratio Type | Ratio |
|---|---|
| EPS-based | 25.29% |
| Free cash flow-based | 20.92% |
Both EPS (25.29%) and FCF (20.92%) payout ratios are within manageable levels, highlighting Cigna's disciplined financial approach in maintaining dividends while investing in future growth.
✅ Cashflow & Capital Efficiency
Analyzing cash flow and capital efficiency is vital for understanding how well a company generates cash and uses capital. These metrics are fundamental for evaluating dividend coverage and potential for future growth.
| Metric | 2023 | 2024 | 2025 |
|---|---|---|---|
| Free Cash Flow Yield | 11.52% | 11.57% | 11.46% |
| Earnings Yield | 5.81% | 4.44% | 8.14% |
| CAPEX to Operating Cash Flow | 13.32% | 13.57% | 12.62% |
| Stock-based Compensation to Revenue | 0% | 0% | 0% |
| Free Cash Flow / Operating Cash Flow Ratio | 87.38% | 86.43% | 87.38% |
The cash flow figures demonstrate strong cash generation, crucial for both reinvestment in the business and reliable dividend payments.
⚠️ Balance Sheet & Leverage Analysis
Evaluating a company's leverage helps assess its financial stability. Smaller ratios indicate less reliance on debt, while liquidity ratios assess the capability of meeting short-term liabilities.
| Metric | 2023 | 2024 | 2025 |
|---|---|---|---|
| Debt-to-Equity | 66.91% | 77.92% | 75.43% |
| Debt-to-Assets | 20.25% | 20.51% | 19.92% |
| Debt-to-Capital | 40.09% | 43.79% | 42.99% |
| Net Debt to EBITDA | 2.13 | 2.13 | 2.05 |
| Current Ratio | 0.77 | 0.84 | 0.85 |
| Quick Ratio | 0.65 | 0.73 | 0.72 |
| Financial Leverage | 3.30 | 3.80 | 3.79 |
The leverage ratios suggest a relatively conservative approach to debt management, ensuring financial stability and operational flexibility for Cigna.
✅ Fundamental Strength & Profitability
High return metrics are indicative of efficient operations and a company's ability to generate profits from its assets. Margin analysis provides insights into cost management and profitability.
| Metric | 2023 | 2024 | 2025 |
|---|---|---|---|
| Return on Equity | 11.17% | 8.37% | 14.28% |
| Return on Assets | 3.38% | 2.20% | 3.77% |
| Net Margin | 2.64% | 1.39% | 2.17% |
| EBIT Margin | 4.63% | 3.92% | 3.26% |
| EBITDA Margin | 5.55% | 4.63% | 4.22% |
| Gross Margin | 12.89% | 10.51% | 9.45% |
| R&D to Revenue | 0% | 0% | 0% |
These profitability metrics reflect Cigna's effective management of its resources and its ability to maintain growth and efficiency in its operations.
📈 Price Development
🔍 Dividend Scoring System
| Criterion | Score | Score Bar |
|---|---|---|
| Dividend Yield | 4 | |
| Dividend Stability | 5 | |
| Dividend Growth | 3 | |
| Payout Ratio | 4 | |
| Financial Stability | 4 | |
| Dividend Continuity | 5 | |
| Cashflow Coverage | 4 | |
| Balance Sheet Quality | 4 |
Total Score: 33/40
🌟 Rating
In conclusion, Cigna Corporation offers a well-rounded dividend proposition, backed by robust financial metrics and a strong historical performance in dividend payments. With solid dividends, prudent payout ratios, and a stable financial position, Cigna represents a sound choice for income investors. Its moderate growth potential complements its role as a cornerstone of a diversified portfolio. Safe to consider as part of a long-term investment strategy.
Smart Data Insight
Master the Perfect Entry & Exit for this Stock
Don't leave your profits to chance. Historically, this stock follows specific seasonal patterns that institutional traders use to maximize returns.
- ✅ Identify the "Golden Buying Window"
- ✅ Avoid high-risk correction cycles
- ✅ Backtested data from the last 20+ years