February 10, 2026 a 07:31 am
CI: Dividend Analysis - Cigna Corporation
Cigna Corporation showcases a resilient dividend profile with a steady dividend history spanning over four decades. With a current dividend yield of 2.07% and a consistent increase in dividends, Cigna offers a compelling opportunity for income-focused investors. Despite a relatively modest payout ratio, the company's financials suggest a sustainable dividend outlook.
📊 Overview
The overview provides a snapshot of Cigna Corporation's dividend metrics and stability in its sector.
| Metric | Value |
|---|---|
| Sector | Health Care |
| Dividend Yield | 2.07 % |
| Current Dividend Per Share | 5.59 USD |
| Dividend History | 45 years |
| Last Cut or Suspension | None |
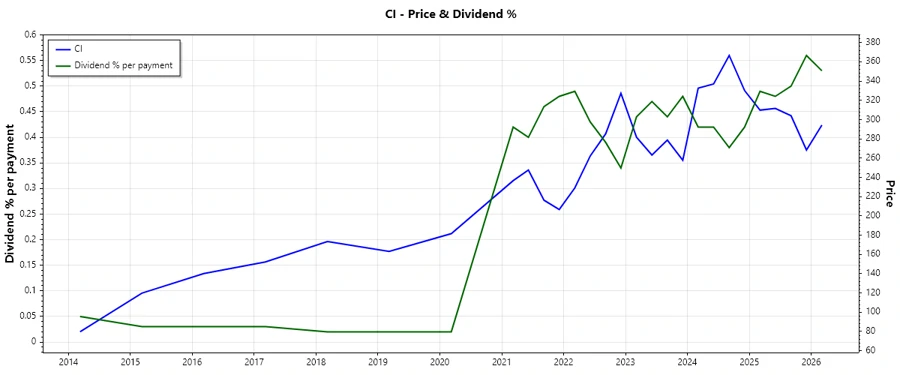
🗣️ Dividend History
Understanding a company's dividend history is crucial as it reflects its commitment to returning value to shareholders and its financial health over time.
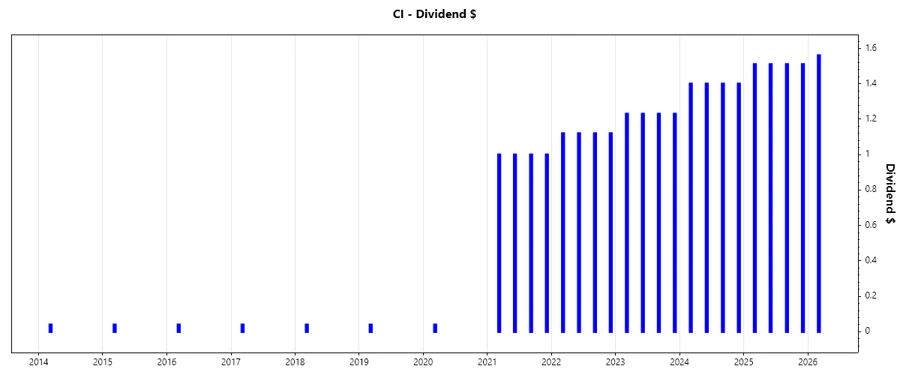
| Year | Dividend per Share (USD) |
|---|---|
| 2026 | 1.56 |
| 2025 | 6.04 |
| 2024 | 5.6 |
| 2023 | 4.92 |
| 2022 | 4.48 |
📈 Dividend Growth
Dividend growth rates are essential to ensure that dividends keep pace with inflation and reflect a company's improving financial performance.
| Time | Growth |
|---|---|
| 3 years | 10.47 % |
| 5 years | 1.73 % |
The average dividend growth is 1.73% over 5 years. This shows moderate but steady dividend growth.
✅ Payout Ratio
The payout ratio is a critical indicator of dividend sustainability, signaling how much of earnings or cash flow are returned to shareholders.
| Key figure | Ratio |
|---|---|
| EPS-based | 24.96 % |
| Free cash flow-based | 20.08 % |
With an EPS-based payout ratio of 24.96% and an FCF-based ratio of 20.08%, Cigna ensures prudent management of its earnings and cash flow, suggesting a sustainable dividend policy.
💵 Cashflow & Capital Efficiency
Evaluating cashflow and capital efficiency provides insights into a company's operational effectiveness and its capacity to fund dividends.
| Year | 2024 | 2023 | 2022 |
|---|---|---|---|
| Free Cash Flow Yield | 11.57% | 11.52% | 7.10% |
| Earnings Yield | 4.44% | 5.81% | 6.46% |
| CAPEX to Operating Cash Flow | 13.57% | 13.32% | 14.96% |
| Stock-based Compensation to Revenue | 0% | 0% | 0% |
| Free Cash Flow / Operating Cash Flow Ratio | 86.43% | 86.68% | 85.04% |
The stability of free cash flow and effective capital utilization underscore Cigna's ability to sustain its dividend payments while reinvesting in growth opportunities.
⚖️ Balance Sheet & Leverage Analysis
A robust balance sheet and effective leverage management are imperative for financial stability and continued dividend reliability.
| Year | 2024 | 2023 | 2022 |
|---|---|---|---|
| Debt-to-Equity | 77.92% | 66.91% | 70.32% |
| Debt-to-Assets | 20.51% | 20.25% | 21.93% |
| Debt-to-Capital | 43.79% | 40.09% | 41.29% |
| Net Debt to EBITDA | 2.13 | 2.13 | 2.45 |
| Current Ratio | 0.83 | 0.77 | 0.73 |
| Quick Ratio | 0.73 | 0.65 | 0.61 |
| Financial Leverage | 3.80 | 3.30 | 3.21 |
Cigna maintains a healthy balance sheet with manageable leverage levels, supporting its financial stability and liquidity whilst assuring dividend consistency.
🧲 Fundamental Strength & Profitability
Key fundamentals and profitability ratios project a company's capacity to grow profits and enhance shareholder value.
| Year | 2024 | 2023 | 2022 |
|---|---|---|---|
| Return on Equity | 8.37% | 11.17% | 14.94% |
| Return on Assets | 2.20% | 3.38% | 4.66% |
| Margins: Net | 1.39% | 2.64% | 3.71% |
| EBIT | 3.92% | 4.63% | 4.75% |
| EBITDA | 4.63% | 5.55% | 5.78% |
| Gross | 10.51% | 12.89% | 13.02% |
| R&D to Revenue | 0% | 0% | 0% |
Cigna's strong return ratios and consistent profitability indicate operational efficiency and potential for sustained earnings growth.
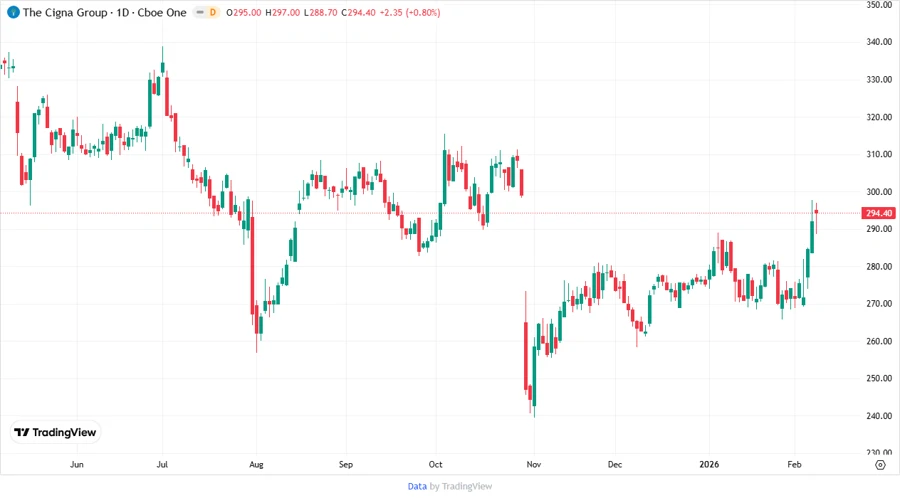
📉 Price Development
📝 Dividend Scoring System
| Criteria | Score | Score Bar |
|---|---|---|
| Dividend Yield | 3 | |
| Dividend Stability | 5 | |
| Dividend Growth | 3 | |
| Payout Ratio | 4 | |
| Financial Stability | 4 | |
| Dividend Continuity | 5 | |
| Cashflow Coverage | 4 | |
| Balance Sheet Quality | 4 |
Total Score: 32/40
🏆 Rating
The comprehensive analysis positions Cigna Corporation as a robust dividend contender with enduring financial stability and attractive cash flow metrics. Investors may consider this stock for steady income and potential capital appreciation.
Smart Data Insight
Master the Perfect Entry & Exit for this Stock
Don't leave your profits to chance. Historically, this stock follows specific seasonal patterns that institutional traders use to maximize returns.
- ✅ Identify the "Golden Buying Window"
- ✅ Avoid high-risk correction cycles
- ✅ Backtested data from the last 20+ years