November 27, 2025 a 07:31 am


CI: Dividend Analysis - Cigna Corporation
As a leading entity in the health sector, Cigna Corporation provides a significant dividend history with a 44-year track record. Their stable payout ratio and consistent dividend increases over recent years highlight strong management practices, making it a noteworthy consideration for dividend-focused investors.
Overview 📊
Cigna Corporation, a key player in the Health Insurance sector, presents a promising dividend profile evidenced by a dividend yield of 2.17% and a current dividend distribution of $5.59 per share. With a robust 44-year dividend payment history and no cuts since 2005, it suggests strong commitment and resilience.
| Detail | Information |
|---|---|
| Sector | Health Insurance |
| Dividend yield | 2.17% |
| Current dividend per share | $5.59 |
| Dividend history | 44 years |
| Last cut or suspension | 2005 |
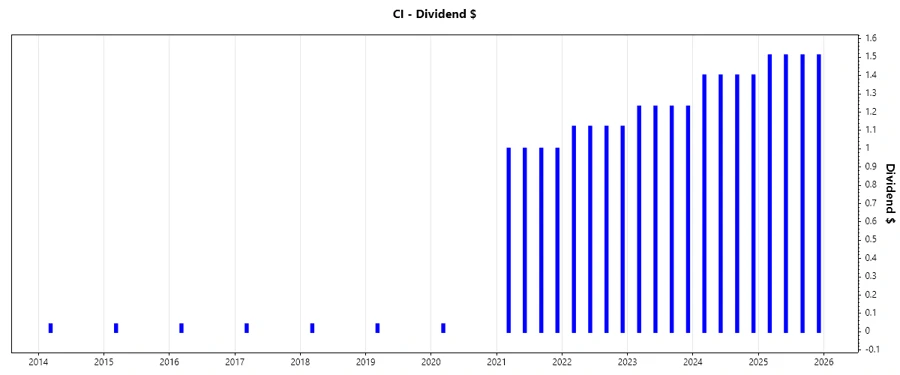
Dividend History 🗣️
Cigna's extensive dividend history underscores its reliability, making it an attractive option for investors seeking steady income. Consistency in dividend payouts is critical in maintaining investor trust and providing a measure of financial health.
| Year | Dividend Per Share |
|---|---|
| 2025 | $6.04 |
| 2024 | $5.60 |
| 2023 | $4.92 |
| 2022 | $4.48 |
| 2021 | $4.00 |
Dividend Growth 📈
Dividend growth is a vital indicator of a company's potential for increasing future income streams for investors. Cigna's moderate growth reflects both stability and potential for reward.
| Time | Growth |
|---|---|
| 3 years | 11.87% |
| 5 years | 168.67% |
The average dividend growth is 1.69% over 5 years. This shows moderate but steady dividend growth, highlighting the company's focus on maintaining its dividend payments over time.
Payout Ratio ✅
The payout ratio measures financial stability concerning dividend sustainability. With an EPS-based ratio of 24.21% and an FCF-based ratio of 20.08%, Cigna maintains a healthy buffer, suggesting ample scope for future dividend adjustments.
| Key figure | Ratio |
|---|---|
| EPS-based | 24.21% |
| Free cash flow-based | 20.08% |
With both ratios comfortably below 100%, Cigna shows prudent financial management in maintaining low payout ratios, supporting long-term financial health and dividend reliability.
Cashflow & Capital Efficiency 💧
Analyzing cash flow and capital efficiency highlights a company's operational effectiveness and its ability to fund dividends. These factors point towards strategic financial health.
| Year | 2024 | 2023 | 2022 |
|---|---|---|---|
| Free Cash Flow Yield | 11.57% | 11.52% | 7.10% |
| Earnings Yield | 4.44% | 5.81% | 6.46% |
| CAPEX to Operating Cash Flow | 13.57% | 13.32% | 14.96% |
| Stock-based Compensation to Revenue | 0% | 0% | 0% |
| Free Cash Flow / Operating Cash Flow Ratio | 86.43% | 86.68% | 85.04% |
The data suggests strategic capital allocation with stable Free Cash Flow Yield and CAPEX ratios, indicating positive cash flow management, crucial for sustaining dividends.
Balance Sheet & Leverage Analysis 📉
A company's balance sheet and leverage are critical for evaluating long-term financial soundness and capacity to cover liabilities, impacting dividend sustainability.
| Year | 2024 | 2023 | 2022 |
|---|---|---|---|
| Debt-to-Equity | 77.92% | 66.91% | 70.32% |
| Debt-to-Assets | 20.51% | 20.25% | 21.93% |
| Debt-to-Capital | 43.79% | 40.09% | 41.29% |
| Net Debt to EBITDA | 2.13 | 2.13 | 2.46 |
| Current Ratio | 0.83 | 0.77 | 0.73 |
| Quick Ratio | 0.73 | 0.65 | 0.61 |
| Financial Leverage | 3.80 | 3.30 | 3.21 |
Cigna's consistent leverage ratios and adequate current and quick ratios signal solid financial stability fundamental to supporting its dividend policy.
Fundamental Strength & Profitability ⚖️
These are key indicators of a company's financial performance, offering insights into operational success and potential for sustainable dividends.
| Year | 2024 | 2023 | 2022 |
|---|---|---|---|
| Return on Equity | 8.37% | 11.17% | 14.94% |
| Return on Assets | 2.20% | 3.38% | 4.66% |
| Margins: Net | 1.39% | 2.64% | 3.71% |
| Margins: EBIT | 3.92% | 4.63% | 4.75% |
| Margins: EBITDA | 4.63% | 5.55% | 5.78% |
| Margins: Gross | 10.51% | 12.89% | 13.02% |
| Research & Development to Revenue | 0% | 0% | 0% |
Cigna demonstrates robust return metrics, indicating effective utilization of equity and assets, along with stable margins pointing to consistent operational effectiveness.
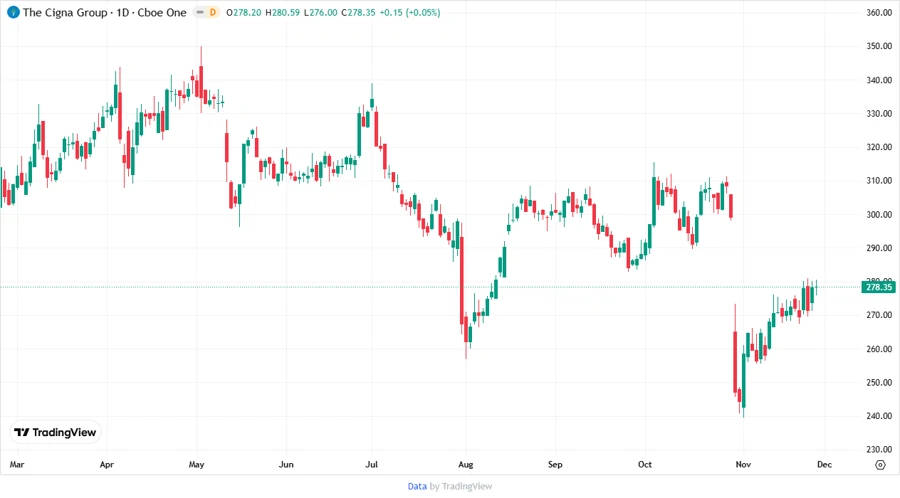
Price Development 📉
Dividend Scoring System
| Category | Score | Score Bar |
|---|---|---|
| Dividend yield | 4 | |
| Dividend Stability | 5 | |
| Dividend growth | 3 | |
| Payout ratio | 4 | |
| Financial stability | 5 | |
| Dividend continuity | 5 | |
| Cashflow Coverage | 4 | |
| Balance Sheet Quality | 4 |
Overall Score: 34/40
Rating
Given Cigna Corporation's strong historical dividend performance, robust financial indicators, and stability, it presents as a reliable dividend investment choice. Its moderate dividend yield, alongside a healthy payout ratio and excellent management practices, ensure a favorable rating and recommendation for investors focused on dividend income stability and growth.