June 22, 2025 a 11:31 am


CI: Dividend Analysis - Cigna Corporation
Cigna Corporation demonstrates a compelling dividend profile with consistent growth over its 44-year history. The dividend yield indicates a stable return for investors, while recent growth trends highlight potential for future increases. The absence of any recent dividend cuts underscores the company's commitment to rewarding its shareholders.
Overview 📊
Cigna Corporation operates within the healthcare sector and exhibits a dividend yield of 1.87%. The current dividend per share is $5.59, reflective of its robust earning capacity. With a long-standing 44-year dividend history and no recent suspensions, Cigna exhibits strong shareholder reliability.
| Metric | Value |
|---|---|
| Sector | Healthcare |
| Dividend yield | 1.87% |
| Current dividend per share | $5.59 |
| Dividend history | 44 years |
| Last cut or suspension | None |
Dividend History 🗣️
Analyzing the past dividend payments provides insight into the company's financial health and its willingness to share profits with stakeholders. Cigna's dividend history illustrates consistent growth with no interruptions, signaling reliable performance.
| Year | Dividend Per Share (USD) |
|---|---|
| 2025 | 3.02 |
| 2024 | 5.60 |
| 2023 | 4.92 |
| 2022 | 4.48 |
| 2021 | 4.00 |
Dividend Growth 📈
Evaluating dividend growth is crucial as it represents the potential for wealth accumulation over time. Cigna's growth in dividends over the recent years indicates a steady appreciation rate.
| Time | Growth |
|---|---|
| 3 years | 0.12% |
| 5 years | 1.69% |
The average dividend growth is 1.69% over the past 5 years. This indicates a moderate but steady dividend growth pattern.
Payout Ratio ✅
The payout ratios provide an insight into dividend sustainability. The EPS-based payout ratio is currently at 31.13%, and the cash flow-based is 24.85%. Both figures are well within reasonable limits, indicating a strong capacity for maintaining dividend payouts.
| Key figure ratio | Value |
|---|---|
| EPS-based | 31.13% |
| Free cash flow-based | 24.85% |
These figures highlight a sustainable level of payouts, ensuring the dividends are well-covered by both earnings and free cash flow.
Cashflow & Capital Efficiency 💡
Examining the cash flow ratios is vital to ascertain the financial efficiency and capital utilization of a company like Cigna, impacting its ability to pay dividends and sustain operations.
| Metric | 2024 | 2023 | 2022 |
|---|---|---|---|
| Free Cash Flow Yield | 11.57% | 11.64% | 7.10% |
| Earnings Yield | 4.44% | 5.87% | 6.46% |
| CAPEX to Operating Cash Flow | 13.57% | 13.32% | 14.96% |
| Stock-based Compensation to Revenue | 0.13% | 0.15% | 0.15% |
| Free Cash Flow / Operating Cash Flow Ratio | 86.43% | 86.68% | 85.04% |
The stability in cash flow and capital efficiency indicates a resilient financial structure that supports robust dividend policies and efficient capital reinvestment.
Balance Sheet & Leverage Analysis ⚖️
A detailed balance sheet analysis offers insights into Cigna's financial stability and leverage, pivotal for understanding long-term dividend sustainability.
| Metric | 2024 | 2023 | 2022 |
|---|---|---|---|
| Debt-to-Equity | 0.78 | 0.67 | 0.69 |
| Debt-to-Assets | 0.21 | 0.20 | 0.22 |
| Debt-to-Capital | 0.44 | 0.40 | 0.41 |
| Net Debt to EBITDA | 2.58 | 2.31 | 2.00 |
| Current Ratio | 0.84 | 0.77 | 2.67 |
| Quick Ratio | 0.73 | 0.77 | 2.23 |
| Financial Leverage | 3.80 | 3.30 | 3.21 |
The debt levels are controlled with reasonable leverage, building a solid foundation for financial stability and dividend preservation.
Fundamental Strength & Profitability 🔍
Evaluating the company’s fundamentals and profitability metrics provides a solid picture of its ability to sustain and grow its dividend payments.
| Metric | 2024 | 2023 | 2022 |
|---|---|---|---|
| Return on Equity | 8.37% | 11.17% | 14.94% |
| Return on Assets | 2.20% | 3.38% | 4.66% |
| Margins: Net | 1.41% | 2.65% | 3.72% |
| Margins: EBIT | 2.74% | 3.56% | 5.35% |
| Margins: EBITDA | 3.87% | 5.12% | 6.98% |
| Research & Development to Revenue | 0.00% | 0.00% | 0.00% |
Cigna demonstrates strong profitability margins, ensuring a healthy capacity for consistent dividends.
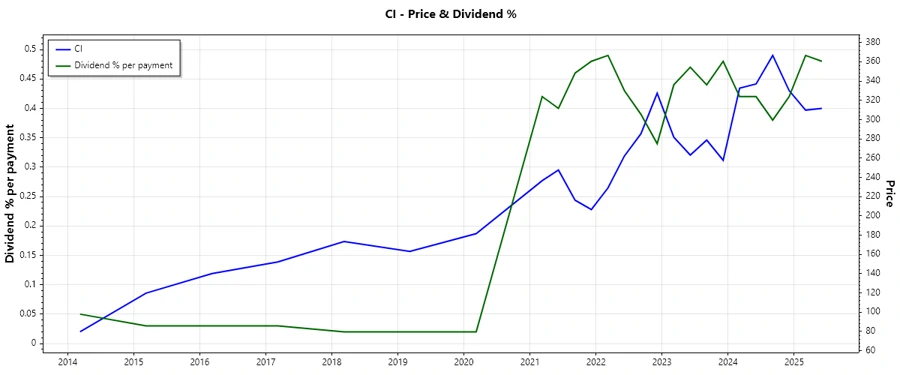
Price Development 📉
Dividend Scoring System ✅
| Criterion | Score | Score Bar |
|---|---|---|
| Dividend yield | 3 | |
| Dividend Stability | 5 | |
| Dividend growth | 2 | |
| Payout ratio | 5 | |
| Financial stability | 4 | |
| Dividend continuity | 5 | |
| Cashflow Coverage | 4 | |
| Balance Sheet Quality | 4 |
Total Score: 32/40
Rating 🏅
Cigna Corporation maintains a stable and moderately attractive dividend profile with marked reliability and consistency. Its strong balance sheet and efficient capital management reinforce the projected sustainability of its dividend payments. Investors might consider Cigna as a favorable option for long-term dividend strategies.
Smart Data Insight
Master the Perfect Entry & Exit for this Stock
Don't leave your profits to chance. Historically, this stock follows specific seasonal patterns that institutional traders use to maximize returns.
- ✅ Identify the "Golden Buying Window"
- ✅ Avoid high-risk correction cycles
- ✅ Backtested data from the last 20+ years