October 11, 2025 a 04:03 am
CINF: Trend and Support & Resistance Analysis - Cincinnati Financial Corporation
The Cincinnati Financial Corporation has demonstrated a fluctuating trend in recent months. As a property casualty insurance provider, its stock reflects not only market sentiment but also the performance and expectations of its core segments such as Commercial Lines and Investments. Recent analysis shows potential changes in trend directions, which are crucial for decision-making in terms of support and resistance levels. Observing these levels offers insights into the stock's potential future performance.
Trend Analysis
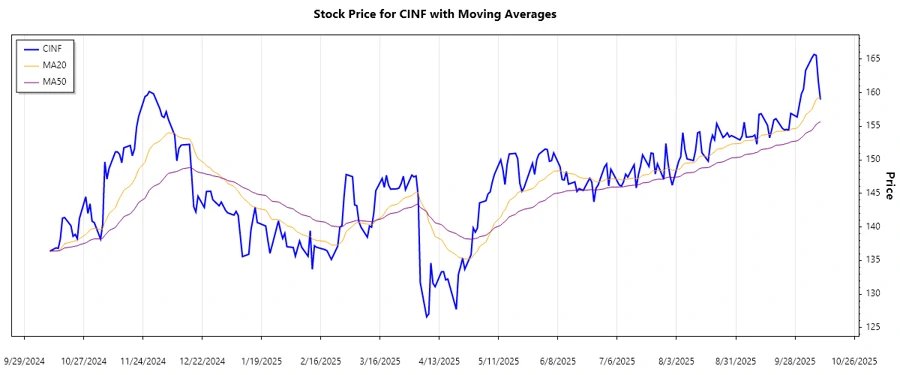
The analysis of closing prices over the past few months indicates a complex trend for CINF. By calculating the Exponential Moving Average (EMA), we find:
| Date | Closing Price | Trend |
|---|---|---|
| 2025-10-10 | $158.97 | ▲ Uptrend |
| 2025-10-09 | $161.68 | ▲ Uptrend |
| 2025-10-08 | $165.55 | ▲ Uptrend |
| 2025-10-07 | $165.69 | ▲ Uptrend |
| 2025-10-06 | $165.21 | ▲ Uptrend |
| 2025-10-03 | $163.29 | ▲ Uptrend |
| 2025-10-02 | $160.51 | ▲ Uptrend |
Recent data suggests that the EMA20 is greater than EMA50, indicating a prevailing uptrend in the short term. This positive signal suggests that the stock is gaining upward momentum, possibly supported by strong company performance or optimistic market conditions.
Support and Resistance
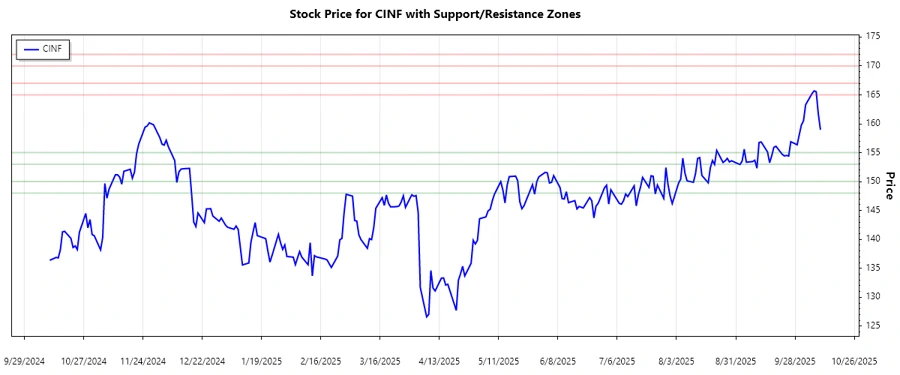
Analyzing the support and resistance levels reveals crucial zones:
| Zone | From ($) | To ($) |
|---|---|---|
| Support 1 | $153.00 | $155.00 |
| Support 2 | $148.00 | $150.00 |
| Resistance 1 | $165.00 | $167.00 |
| Resistance 2 | $170.00 | $172.00 |
The current price is closely positioned within the Resistance 1 zone, indicating it could face selling pressure. If the price manages to break through, it could enter the next resistance zone. Conversely, a pullback could see it seeking support at lower levels.
Conclusion
The stock of Cincinnati Financial Corporation presents opportunities and potential risks. A prevailing uptrend suggested by the EMA indicators gives a bullish outlook, but this is juxtaposed against critical resistance levels that could hinder upward price movement. Investors should watch for a breakout above resistance levels for further gains or a fallback toward established support zones for potential buying opportunities. With the stock's intrinsic link to market sentiments and core business performance, the upcoming sessions will be pivotal in determining continuation or reversal of the trend. Analysts should consider these factors when forecasting future performance.
Smart Data Insight
Master the Perfect Entry & Exit for this Stock
Don't leave your profits to chance. Historically, this stock follows specific seasonal patterns that institutional traders use to maximize returns.
- ✅ Identify the "Golden Buying Window"
- ✅ Avoid high-risk correction cycles
- ✅ Backtested data from the last 20+ years