July 26, 2025 a 08:15 am


CINF: Trend and Support & Resistance Analysis - Cincinnati Financial Corporation
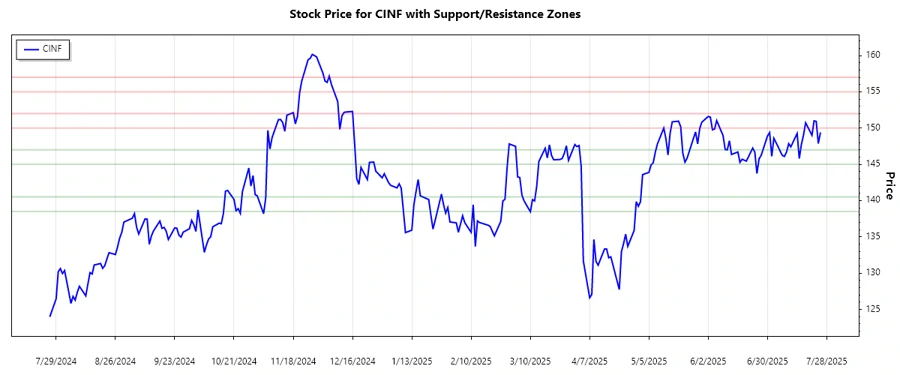
The Cincinnati Financial Corporation (CINF) operates in the U.S. providing a wide range of insurance products. Recently, CINF experienced fluctuating stock prices, influencing both trends and support/resistance levels. This analysis aims to provide insights into the latest technical trends and significant support and resistance zones, offering a clearer forecast of what might lie ahead for CINF investors.
Trend Analysis
| Date | Close Price | Trend |
|---|---|---|
| 2025-07-25 | 149.4 | ▲ |
| 2025-07-24 | 147.87 | ▼ |
| 2025-07-23 | 150.92 | ▲ |
| 2025-07-22 | 151.0 | ▲ |
| 2025-07-21 | 149.0 | ▼ |
| 2025-07-18 | 150.73 | ▲ |
| 2025-07-17 | 149.03 | ▼ |
The EMA indicators align closely, supporting a slight upward trend. CINF appears to be gaining traction, hinting at a potential bullish sentiment in the market.
Support and Resistance
| Zone Type | Level From | Level To |
|---|---|---|
| Support Zone 1 | 145.0 | 147.0 |
| Support Zone 2 | 138.5 | 140.5 |
| Resistance Zone 1 | 150.0 | 152.0 |
| Resistance Zone 2 | 155.0 | 157.0 |
Currently, CINF is sitting within the lower regions of a support zone. This could imply a consolidation phase before a potential upward breakout.
Conclusion
CINF is displaying indications of a nascent uptrend with close EMA values. Support levels provide a base for accumulation, potentially setting the stage for a breakout. However, investors should remain vigilant of any external economic influences that could shift these dynamics. Support and resistance zones confirm market stability, offering tactical entry and exit points. Overall, CINF offers moderate growth potential with current market trends favoring bullish investors. Analysts should watch for further price actions to gauge long-term trajectory.
Smart Data Insight
Master the Perfect Entry & Exit for this Stock
Don't leave your profits to chance. Historically, this stock follows specific seasonal patterns that institutional traders use to maximize returns.
- ✅ Identify the "Golden Buying Window"
- ✅ Avoid high-risk correction cycles
- ✅ Backtested data from the last 20+ years