October 23, 2025 a 11:45 am
CINF: Fibonacci Analysis - Cincinnati Financial Corporation
Cincinnati Financial Corporation exhibits strength with its diversified insurance segments and steady investment portfolio. Recently, the stock has shown an upward trend, reflecting its resilience and potential for growth in the insurance industry. Investors seeking stability and gradual growth may find CINF appealing. However, market volatility and changes in regulatory policies could pose risks. Overall, it's an option worth considering for those seeking stability in their investment portfolio.
Fibonacci Analysis
| Detail | Information | ||||||||||||
|---|---|---|---|---|---|---|---|---|---|---|---|---|---|
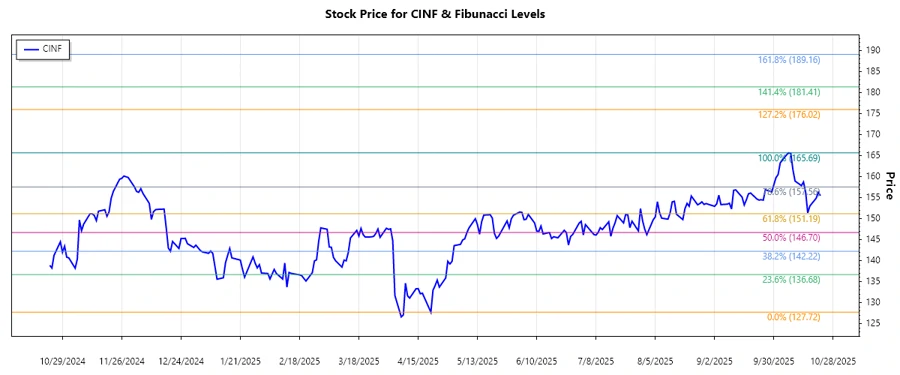
| Analyzed Trend Period | April 21, 2025 - October 8, 2025 | ||||||||||||
| High Price | $165.69 on October 7, 2025 | ||||||||||||
| Low Price | $127.72 on April 21, 2025 | ||||||||||||
| Fibonacci Levels |
|
||||||||||||
| Current Price | $155.47 on October 22, 2025 | ||||||||||||
| Current Retracement Zone | 0.5 | ||||||||||||
| Technical Interpretation | The current price at the 0.5 Fibonacci level suggests a critical point. It may serve as a support level, indicating potential for further upward movement if it holds. |
Conclusion
The Cincinnati Financial Corporation stock has demonstrated positive traction, underscored by a significant upward trend over recent months. The current price situated at the 0.5 Fibonacci level depicts a pivotal support area that could dictate future movements. If this area holds, it may offer a robust base for further appreciation. However, failure to hold could trigger a descent to lower support levels. The company’s diverse insurance and investment portfolios present both opportunities for growth and risks amidst market fluctuations. Analysts will closely watch whether the stock maintains its upward momentum or faces resistance at higher levels, signaling actionable insights for informed investment decisions.
Smart Data Insight
Master the Perfect Entry & Exit for this Stock
Don't leave your profits to chance. Historically, this stock follows specific seasonal patterns that institutional traders use to maximize returns.
- ✅ Identify the "Golden Buying Window"
- ✅ Avoid high-risk correction cycles
- ✅ Backtested data from the last 20+ years