April 07, 2026 a 03:31 pm

CINF: Dividend Analysis - Cincinnati Financial Corporation
Cincinnati Financial Corporation, a distinguished entity with a market capitalization of $25 billion, showcases a respectable dividend yield of 2.24% with a stable growth trajectory. The company's impressive 43-year dividend history accentuates its commitment to shareholder returns. Strategic financial management and robust fundamental strength fortify its position as a reliable dividend player.
📊 Overview
| Sector | Dividend yield | Current dividend per share | Dividend history | Last cut or suspension |
|---|---|---|---|---|
| Financial | 2.24% | $3.33 USD | 43 years | None |
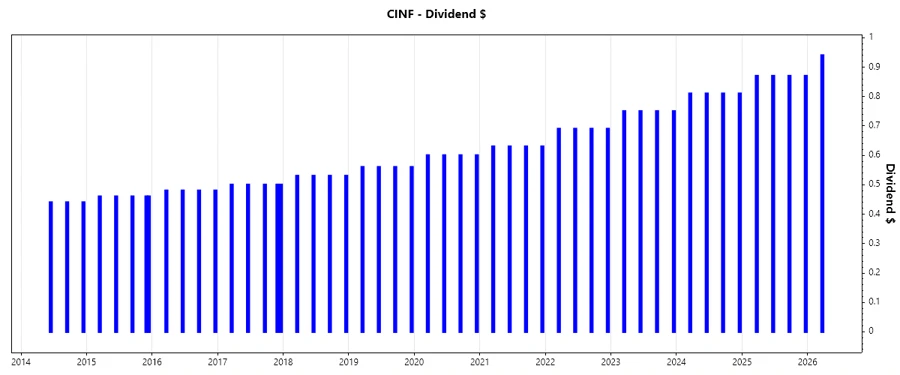
📈 Dividend History
Cincinnati Financial Corporation has maintained a consistent dividend history, creating a reliable income stream for investors. This track record enhances investor confidence and sustains the company's reputation as a stable dividend payer.
| Year | Dividend per Share (USD) |
|---|---|
| 2026 | 0.94 |
| 2025 | 3.48 |
| 2024 | 3.24 |
| 2023 | 3.00 |
| 2022 | 2.76 |
⬆️ Dividend Growth
Examining Cincinnati Financial's dividend growth reveals a commitment to increasing shareholder value. The measured increases indicate an alignment with strategic financial planning and a vision of sustainable growth.
| Time | Growth |
|---|---|
| 3 years | 8.03% |
| 5 years | 7.71% |
The average dividend growth is 7.71% over 5 years. This shows moderate but steady dividend growth.
💰 Payout Ratio
Payout ratios are essential to understand the sustainability of dividend payments. Cincinnati Financial's EPS-based payout ratio of 21.94% and FCF-based payout ratio of 16.70% reflect a prudent approach, suggesting that dividends are well-covered.
| Key figure | Ratio |
|---|---|
| EPS-based | 21.94% |
| Free cash flow-based | 16.70% |
The relatively low payout ratios suggest that Cincinnati Financial has ample room to maintain or even increase dividends without over-leveraging its financials.
💵 Cashflow & Capital Efficiency
Evaluating cash flow dynamics and capital allocation efficiency provides insights into operational and financial flexibility. With robust cash flow yields and disciplined capital spending reflected in CAPEX to Operating Cash Flow ratios, Cincinnati Financial exhibits operational competence.
| Metric | 2025 | 2024 | 2023 |
|---|---|---|---|
| Free Cash Flow Yield | 12.00% | 11.69% | 12.44% |
| Earnings Yield | 9.29% | 10.20% | 11.27% |
| CAPEX to Operating Cash Flow | 0.642% | 0.831% | 0.877% |
| Stock-based Compensation to Revenue | 0% | 0% | 0% |
| Free Cash Flow / Operating Cash Flow Ratio | 99.36% | 99.17% | 99.12% |
Strong cash flow management boosts Cincinnati Financial’s ability to fund dividend payouts, suggesting a very stable financial footing.
📝 Balance Sheet & Leverage Analysis
An assessment of balance sheet metrics ensures understanding of leverage and financial health. Cincinnati Financial presents a conservative debt profile, highlighted by favorable debt ratios that indicate solid fiscal management.
| Metric | 2025 | 2024 | 2023 |
|---|---|---|---|
| Debt-to-Equity | 5.57% | 6.28% | 7.22% |
| Debt-to-Assets | 2.16% | 2.40% | 2.67% |
| Debt-to-Capital | 5.27% | 5.91% | 6.73% |
| Net Debt to EBITDA | -0.17 | -0.036 | -0.0135 |
| Current Ratio | 1.29 | 1.31 | 1.26 |
| Quick Ratio | 1.29 | 1.31 | 1.26 |
| Financial Leverage | 2.58 | 2.62 | 2.71 |
The prudent management of debt reinforces Cincinnati Financial’s capacity to withstand financial stress, highlighting its resilience.
📊 Fundamental Strength & Profitability
Analyzing core profitability and returns unveils the intrinsic value generation capabilities of Cincinnati Financial. The metrics underscore robust profitability and effective capital utilization, supporting sustained dividend strengths.
| Metric | 2025 | 2024 | 2023 |
|---|---|---|---|
| Return on Equity (ROE) | 15.04% | 16.45% | 15.23% |
| Return on Assets (ROA) | 5.84% | 6.28% | 5.62% |
| Net Margin | 18.95% | 20.22% | 18.41% |
| EBIT Margin | 24.01% | 25.68% | 23.27% |
| EBITDA Margin | 25.34% | 26.82% | 24.39% |
| Gross Margin | 50.12% | 49.40% | 47.33% |
| R&D to Revenue | 0% | 0% | 0% |
Cincinnati Financial's stable profitability ratios demonstrate a consistent capacity to convert assets into net earnings, fortifying its ability to maintain dividend performance.
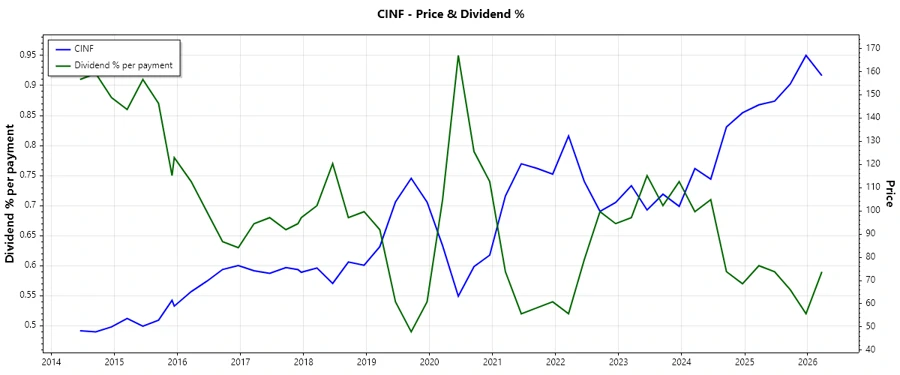
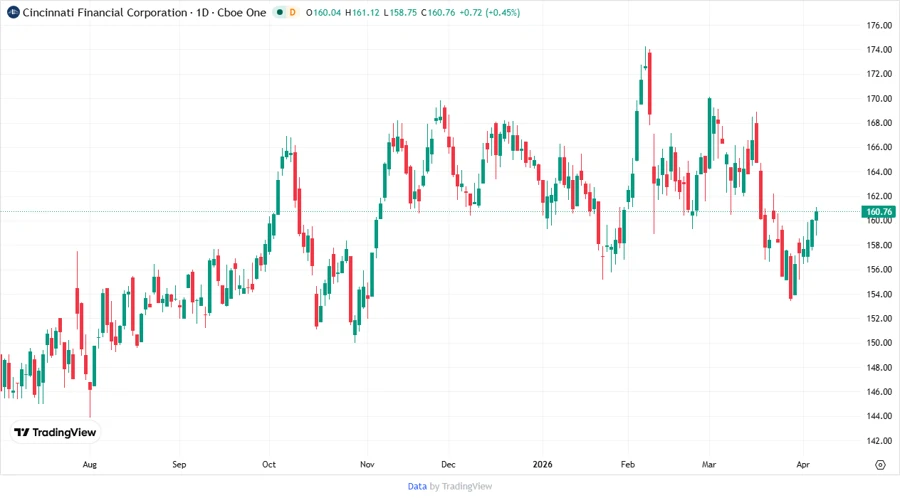
📉 Price Development
🔍 Dividend Scoring System
| Criteria | Score | Score Bar |
|---|---|---|
| Dividend yield | 4 | |
| Dividend Stability | 5 | |
| Dividend growth | 4 | |
| Payout ratio | 5 | |
| Financial stability | 5 | |
| Dividend continuity | 5 | |
| Cashflow Coverage | 5 | |
| Balance Sheet Quality | 5 |
Total Score: 38/40
🗣️ Rating
Considering the comprehensive analysis of Cincinnati Financial Corporation's dividend and financial metrics, the company demonstrates superior stability and growth prospects. Its commitment to consistently rewarding shareholders establishes it as an attractive choice for income-focused investors, meriting a strong buy recommendation.