August 17, 2025 a 03:31 am

CINF: Dividend Analysis - Cincinnati Financial Corporation
Cincinnati Financial Corporation has established a strong reputation with a remarkable dividend history. Despite some volatility in recent financials, the company's consistent dividend payments and a prudent payout ratio make it a compelling prospect for dividend-focused investors. However, the modest growth rates and certain areas of financial stability warrant cautious optimism.
📊 Overview
An analysis of Cincinnati Financial's sector reveals its standing as a robust insurance entity. The financial metrics support its standing, with notable dividend consistency over 42 years and a yield of 2.28%.
| Sector | Dividend Yield | Current Dividend per Share | Dividend History | Last Cut or Suspension |
|---|---|---|---|---|
| Insurance | 2.28% | 3.13 USD | 42 years | None |
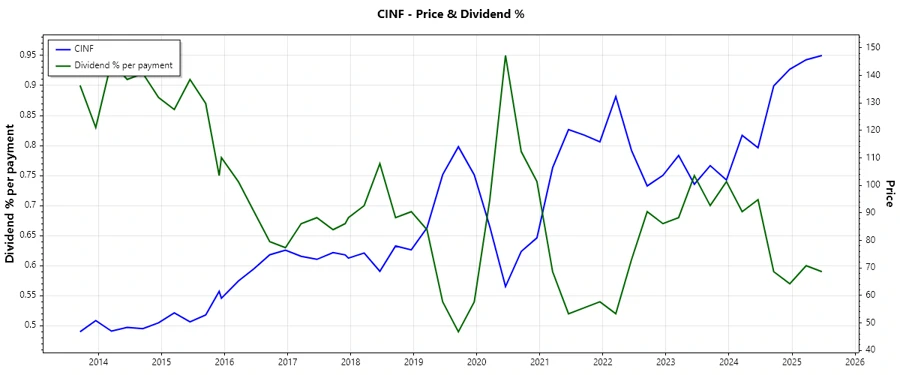
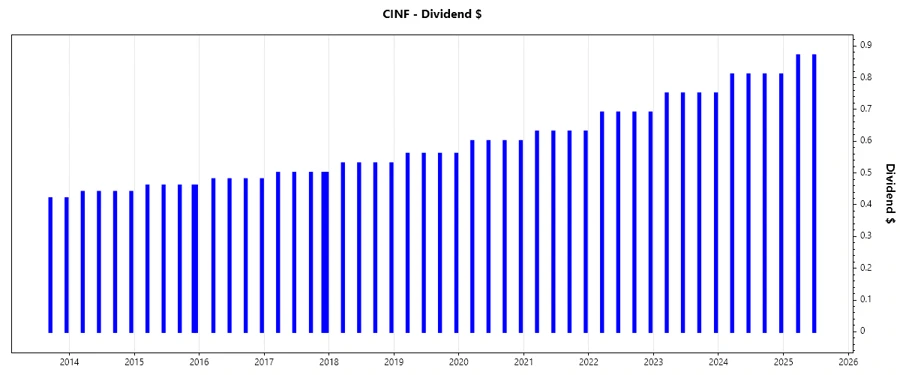
📉 Dividend History
The company's extensive dividend history underscores its commitment to shareholder returns, highlighting robust payment patterns crucial for income-focused portfolios.
| Year | Dividend per Share |
|---|---|
| 2025 | 1.74 USD |
| 2024 | 3.24 USD |
| 2023 | 3.00 USD |
| 2022 | 2.76 USD |
| 2021 | 2.52 USD |
📈 Dividend Growth
The dividend growth figures reflect a moderate yet reliable increase over the years, supporting a stable income stream from this investment.
| Time | Growth |
|---|---|
| 3 years | 8.74% |
| 5 years | 7.66% |
The average dividend growth is 7.66% over 5 years. This shows moderate but steady dividend growth.
✅ Payout Ratio
The payout ratio analysis shows a disciplined approach to dividend payments, ensuring sustainable distributions without overextending financial resources.
| Key Figure | Ratio |
|---|---|
| EPS-based | 26.91% |
| Free cash flow-based | 18.88% |
The EPS-based payout ratio of 26.91% suggests ample room for maintaining or even increasing dividends, while the FCF-based ratio of 18.88% highlights financial prudence.
🗣️ Cashflow & Capital Efficiency
Analyzing the cash flow and capital efficiency metrics reveals Cincinnati Financial's proficient management of operating funds, ensuring operational effectiveness and shareholder value.
| Year | 2024 | 2023 | 2022 |
|---|---|---|---|
| Free Cash Flow Yield | 11.69% | 12.44% | 12.53% |
| Earnings Yield | 10.20% | 11.27% | -2.99% |
| CAPEX to Operating Cash Flow | 0.38% | 0.88% | 0.73% |
| Stock-based Compensation to Revenue | 0% | 0% | 0.55% |
| FCF / Operating Cash Flow Ratio | 99.17% | 99.12% | 99.27% |
The cash flow metrics illustrate robust free cash flow yields, reinforcing operational liquidity and capital utilization efficiency.
📊 Balance Sheet & Leverage Analysis
The balance sheet and leverage metrics provide insight into financial health, with manageable debt levels and solid liquidity ratios enhancing the company's creditworthiness and resilience.
| Year | 2024 | 2023 | 2022 |
|---|---|---|---|
| Debt-to-Equity | 0.06 | 0.07 | 0.08 |
| Debt-to-Assets | 0.02 | 0.03 | 0.03 |
| Debt-to-Capital | 0.06 | 0.07 | 0.08 |
| Net Debt to EBITDA | -0.036 | -0.014 | 0.726 |
| Current Ratio | 39.32 | 0 | 0 |
| Quick Ratio | 39.32 | 0 | 0 |
The leverage ratios suggest a conservative approach to leveraging, strengthening financial stability and enabling future growth investments.
📈 Fundamental Strength & Profitability
Reviewing the profitability metrics provides insights into the company's ability to generate income efficiently and effectively for shareholders.
| Year | 2024 | 2023 | 2022 |
|---|---|---|---|
| Return on Equity | 16.45% | 15.23% | -4.61% |
| Return on Assets | 6.28% | 5.62% | -1.64% |
| Net Profit Margin | 20.22% | 18.41% | -7.42% |
| EBIT Margin | 25.68% | 23.27% | -9.77% |
| EBITDA Margin | 26.82% | 24.39% | -7.83% |
Profitability ratios indicate a robust margin profile sustaining shareholder returns, despite past fluctuations.
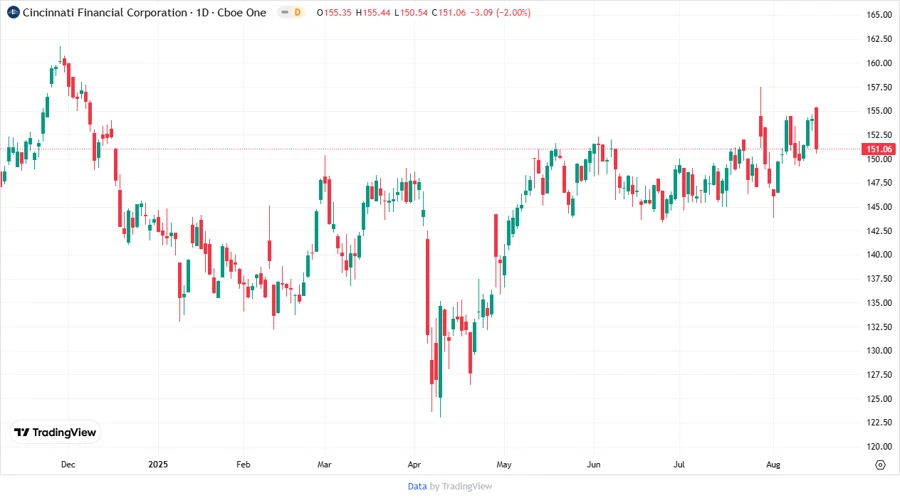
📉 Price Development
✅ Dividend Scoring System
| Criteria | Score | Rating |
|---|---|---|
| Dividend Yield | 4 | |
| Dividend Stability | 5 | |
| Dividend Growth | 3 | |
| Payout Ratio | 5 | |
| Financial Stability | 4 | |
| Dividend Continuity | 5 | |
| Cashflow Coverage | 5 | |
| Balance Sheet Quality | 4 |
Total Score: 35/40
🗣️ Rating
Overall, Cincinnati Financial offers a solid dividend profile characterized by reliability and financial strength. Despite areas needing attention, particularly in growth and short-term financial metrics, the company merits a high rating for dividend-focused portfolios.
Smart Data Insight
Master the Perfect Entry & Exit for this Stock
Don't leave your profits to chance. Historically, this stock follows specific seasonal patterns that institutional traders use to maximize returns.
- ✅ Identify the "Golden Buying Window"
- ✅ Avoid high-risk correction cycles
- ✅ Backtested data from the last 20+ years