May 09, 2026 a 08:15 am

CHTR: Trend and Support & Resistance Analysis - Charter Communications, Inc.
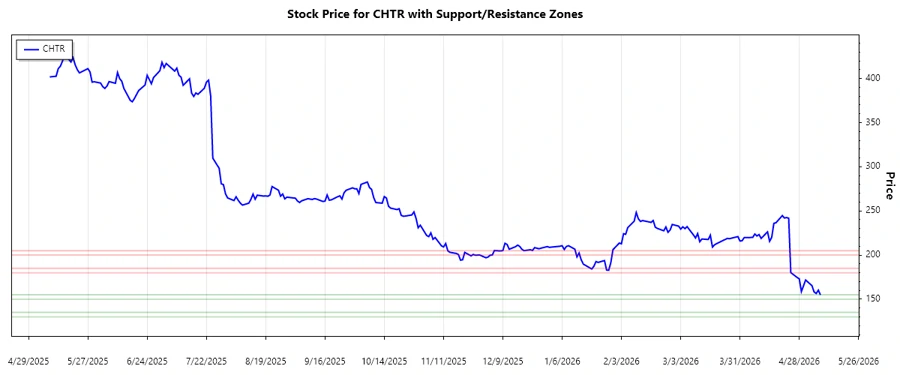
Charter Communications, Inc. (NASDAQ: CHTR) has shown significant movement in recent months. Given its role as a major broadband and cable operator, market shifts can be influenced by a variety of factors, including technological advances and changes in consumer demand. The recent price movement suggests a notable downward trend, potentially indicating market concerns or strategic company challenges. Investors should monitor key support levels, as breaches could signal further declines. Conversely, a rebound at support levels might suggest a stabilization or reversal.
Trend Analysis
Analyzing the recent market data, we observe the following trends in Charter Communications, Inc.'s stock prices. Based on the calculated moving averages, we identify the current stock trend.
| Date | Close Price | Trend |
|---|---|---|
| 2026-05-08 | 154.86 | ▼ |
| 2026-05-07 | 160.24 | ▼ |
| 2026-05-06 | 156.52 | ▼ |
| 2026-05-05 | 158.23 | ▼ |
| 2026-05-04 | 165.34 | ▼ |
| 2026-05-01 | 171.74 | ▼ |
| 2026-04-30 | 165.17 | ▼ |
The recent analysis, with EMA20 falling below EMA50, indicates a prevailing downtrend, reflecting potential market concerns.
Support and Resistance Analysis
We identify key support and resistance zones for CHTR, which can serve as potential bounce or reversal points for the stock price.
| Zone Type | From | To |
|---|---|---|
| Support 1 | 150.00 | 155.00 |
| Support 2 | 130.00 | 135.00 |
| Resistance 1 | 180.00 | 185.00 |
| Resistance 2 | 200.00 | 205.00 |
The current price is approaching a support zone, indicating a possible stabilization or further decline. Monitoring these levels is crucial.
Conclusion
Charter Communications, Inc. is experiencing a downward trend, with share prices falling below key moving averages. This suggests investor caution and potential challenges in its market environment. Support levels between 150.00 and 155.00 may offer short-term stabilization. However, if breached, further declines towards the 130.00-135.00 range may occur. Resistance is distant, highlighting limited upward potential without significant positive catalysts. Analysts should weigh the risks of further declines against potential rebounds near support levels.
Smart Data Insight
Master the Perfect Entry & Exit for this Stock
Don't leave your profits to chance. Historically, this stock follows specific seasonal patterns that institutional traders use to maximize returns.
- ✅ Identify the "Golden Buying Window"
- ✅ Avoid high-risk correction cycles
- ✅ Backtested data from the last 20+ years