October 28, 2025 a 10:15 am

CHTR: Fibonacci Analysis - Charter Communications, Inc.
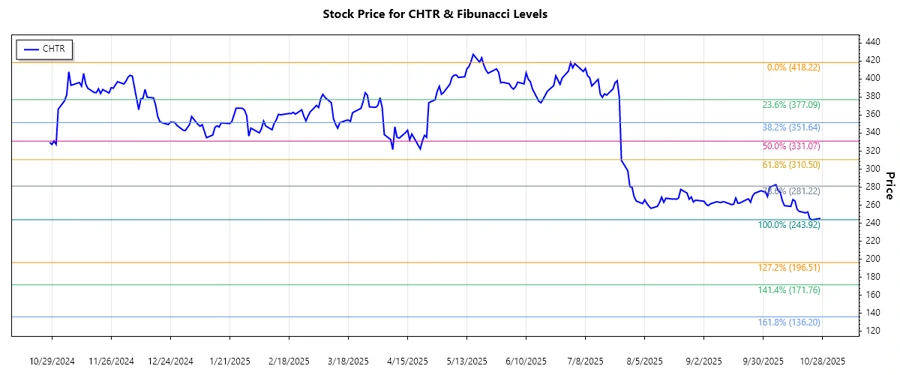
Charter Communications Inc., operating as a major broadband and cable company, has shown significant market fluctuations. Currently, the stock exhibits a dominant downward trend. With diverse services ranging from video to mobile solutions, market dynamics and technological advancements significantly impact its stock value. This analysis delves into the retracement levels following the identified trend.
Fibonacci Analysis
| Aspect | Details |
|---|---|
| Trend Start Date | 2025-07-23 |
| Trend End Date | 2025-10-24 |
| High Price and Date | $418.22 on 2025-07-01 |
| Low Price and Date | $243.92 on 2025-10-23 |
| Fibonacci 0.236 | $296.71 |
| Fibonacci 0.382 | $316.91 |
| Fibonacci 0.5 | $331.07 |
| Fibonacci 0.618 | $345.23 |
| Fibonacci 0.786 | $366.07 |
| Current Price and Retracement Zone | $245.44 - Below all key retracement levels |
| Technical Interpretation | The stock remains below significant Fibonacci levels, suggesting strong resistance. Potential support may form as these levels are tested. |
Conclusion
Charter Communications' recent stock trend indicates a notable decline from its peak. This downturn traversing beneath several critical Fibonacci retracement levels signals potential continued pressure unless reversals occur. Opportunities may arise for investors to seize reduced valuations, but caution is warranted as the stock remains vulnerable to market conditions and competitive pressures. While the firm's expansive service portfolio could drive recovery, significant breakthroughs might be necessary to counteract the prevailing trend effectively. For analysts, monitoring the interaction with these tested retracement levels will be crucial in foreseeing support intensity and gauging future price trajectory.