October 21, 2025 a 11:45 am
CHTR: Fibonacci Analysis - Charter Communications, Inc.
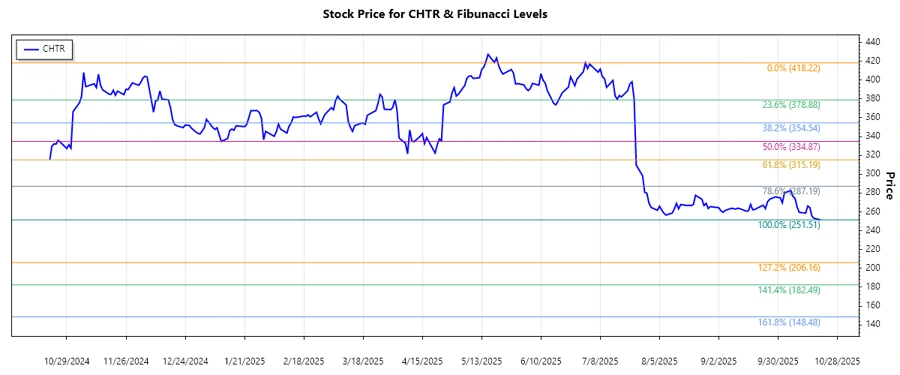
Charter Communications' recent price trends suggest significant volatility, with the price peaking in July 2025 and experiencing a downward trajectory since then. Despite fluctuations, the stock demonstrated a robust growth phase prior to the reversal. Investors should consider both the retracement levels and other technical indicators before taking any action.
Fibonacci Analysis
| Metrics | Details |
|---|---|
| Trend Start Date | 2025-07-08 |
| Trend End Date | 2025-10-20 |
| High (Price & Date) | $418.22 on 2025-07-01 |
| Low (Price & Date) | $251.51 on 2025-10-20 |
| Fibonacci Levels |
0.236: $286.03 0.382: $299.89 0.5: $315.14 0.618: $330.39 0.786: $353.30 |
| Current Retracement Zone | 0.236 - 0.382 |
| Technical Interpretation | The current price sits in the 0.236 retracement zone, indicating potential for short-term resistance. |
Conclusion
The current retracement phase of Charter Communications’ stock may indicate a pause in its previous downtrend, with resistance likely in the 0.236 to 0.382 Fibonacci levels range. However, the dominant downtrend reflects significant bearish sentiment that can be seen in the lowered high from its July peak. Investors and analysts should monitor the support and resistance levels closely while considering broader market trends and company performance metrics. Opportunities may arise if the stock breaks through key levels, with downside protection recommended due to existing volatility and risks.
Smart Data Insight
Master the Perfect Entry & Exit for this Stock
Don't leave your profits to chance. Historically, this stock follows specific seasonal patterns that institutional traders use to maximize returns.
- ✅ Identify the "Golden Buying Window"
- ✅ Avoid high-risk correction cycles
- ✅ Backtested data from the last 20+ years