July 02, 2025 a 10:15 am
CHTR: Fibonacci Analysis - Charter Communications, Inc.
Charter Communications, Inc. has experienced recent volatility in its stock prices, reflecting the broader dynamics within the broadband and cable industry. With a competitive market and evolving consumer preferences, Charter's ability to innovate and deliver value-added services remains crucial for its growth prospects and stock performance. Recent trends indicate an opportunity for technical investors to analyze retracement levels to make informed decisions.
Fibonacci Analysis
| Detail | Information |
|---|---|
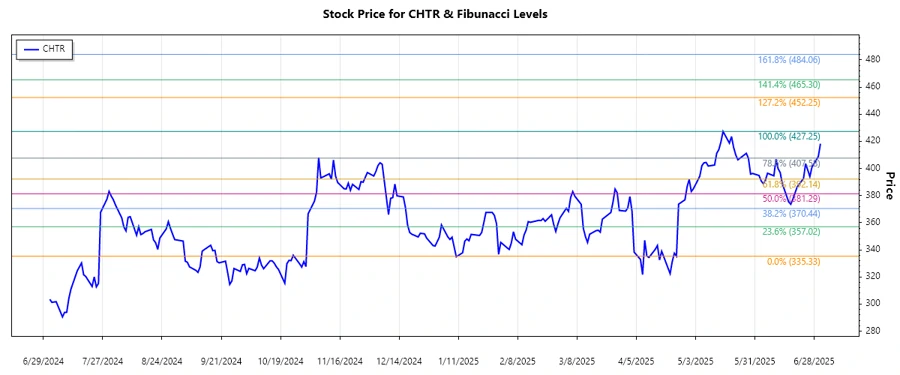
| Trend Period | 2025-03-10 to 2025-07-01 |
| High Point | $427.25 on 2025-05-16 |
| Low Point | $335.33 on 2025-04-24 |
| Fibonacci Levels |
|
| Current Price | $418.22 |
| Retracement Zone | None |
| Technical Interpretation | The current price is above the 0.786 retracement level, indicating the possibility of a continued upward trend with $402.73 as a potential support level. |
Conclusion
The Fibonacci analysis for Charter Communications, Inc. indicates that the stock has surpassed significant retracement levels, suggesting bullish momentum. However, investors should exercise caution due to market volatility and external factors affecting the telecommunications industry. Strategic positioning near identified support levels could mitigate risks. Chart patterns and trend confirmations should be monitored to exploit upcoming opportunities. Analysts must consider the company's ability to adapt to technological advancements and competitive forces, which will significantly impact future stock performance.
JSON:
Smart Data Insight
Master the Perfect Entry & Exit for this Stock
Don't leave your profits to chance. Historically, this stock follows specific seasonal patterns that institutional traders use to maximize returns.
- ✅ Identify the "Golden Buying Window"
- ✅ Avoid high-risk correction cycles
- ✅ Backtested data from the last 20+ years