August 26, 2025 a 03:15 am

CHRW: Trend and Support & Resistance Analysis - C.H. Robinson Worldwide, Inc.
C.H. Robinson Worldwide, Inc. has demonstrated significant movement over the past months. From logistical services globally, its share prices reflect the industry's dynamism. The analysis shows that CHRW stock has potential strategic points investors might leverage. Understanding EMA crossovers and identifying pivotal support and resistance zones can offer insights into potential market movements. Here, we delve into a detailed technical analysis, observing both trend dynamics and pivotal price levels.
Trend Analysis
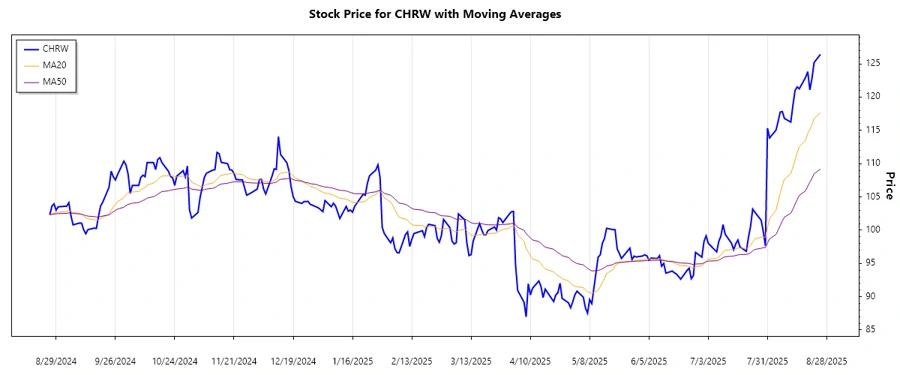
The analysis of the closing prices over the past months helps us identify the current trend using EMA indicators. The EMA20 and EMA50 reveal:
| Date | Closing Price | Trend |
|---|---|---|
| 2025-08-25 | 126.41 | ▲ |
| 2025-08-22 | 125.18 | ▲ |
| 2025-08-21 | 122.8 | ▲ |
| 2025-08-20 | 121.08 | ▲ |
| 2025-08-19 | 123.82 | ▲ |
| 2025-08-18 | 122.97 | ▲ |
| 2025-08-15 | 121.24 | ▲ |
Given that the EMA20 is consistently above EMA50, there is a clear upward trend (▲). This indicates bullish market momentum.
Support- and Resistance
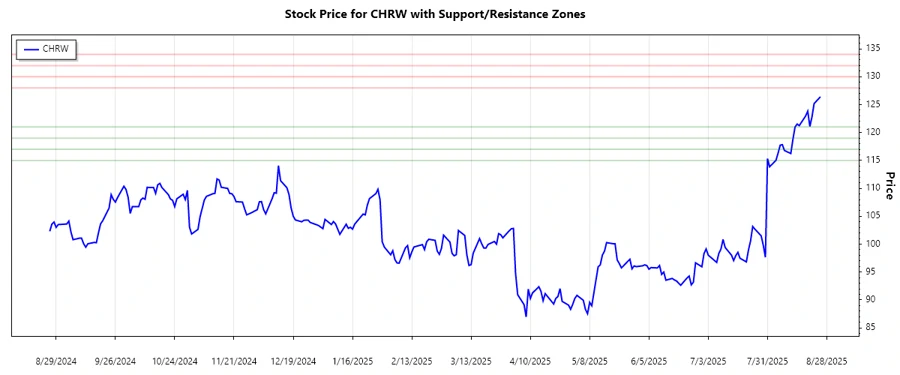
Understanding the critical price zones assists in assessing potential entry or exit points.
| Zone Type | From | To |
|---|---|---|
| Support 1 | 115.00 | 117.00 |
| Support 2 | 119.00 | 121.00 |
| Resistance 1 | 128.00 | 130.00 |
| Resistance 2 | 132.00 | 134.00 |
The current price hovers above the support zone, indicating strength and the possibility of an upward breakout through resistance.
Conclusion
The analysis of CHRW's recent price action indicates a strong upward momentum backed by both technical indicators and support levels. The EMA crossovers suggest a bullish trend, while the current price suggests continued strength as it positions itself above support levels. However, the stock's proximity to resistance requires cautious optimism, as breakthroughs can signify continued momentum. Investors should watch for confirmation of breakout patterns or reversals near the identified zones to make informed decisions.