May 29, 2025 a 09:03 am

CHRW: Trend and Support & Resistance Analysis - C.H. Robinson Worldwide, Inc.
C.H. Robinson Worldwide, Inc. operates in a versatile sector that provides essential services in freight transportation and logistics solutions globally. The stock has shown mixed trends over the past months amidst fluctuating market conditions. Understanding the technical indicators such as EMA trends and support & resistance levels provides a glimpse into potential market movements. Investors should consider both the technical aspects and broader market conditions when assessing this stock for potential opportunities and risks.
Trend Analysis
The analysis of C.H. Robinson's stock over recent months shows a pattern of fluctuations. To gauge the trend direction accurately, we calculate the EMA20 and EMA50. When the EMA20 is above the EMA50, an uptrend indicates bullish sentiments; when below, a downtrend suggests bearish pressure. A comparison shows:
| Date | Close Price | Trend |
|---|---|---|
| 2025-05-28 | 95.58 | ▼ Downtrend |
| 2025-05-27 | 97.30 | ▼ Downtrend |
| 2025-05-23 | 95.75 | ▼ Downtrend |
| 2025-05-22 | 96.52 | ▼ Downtrend |
| 2025-05-21 | 97.18 | ▼ Downtrend |
| 2025-05-20 | 100.07 | ▼ Downtrend |
| 2025-05-19 | 100.08 | ▼ Downtrend |
Given the recent analysis, the trend shows a consistent downtrend that may suggest caution for short-term investments.
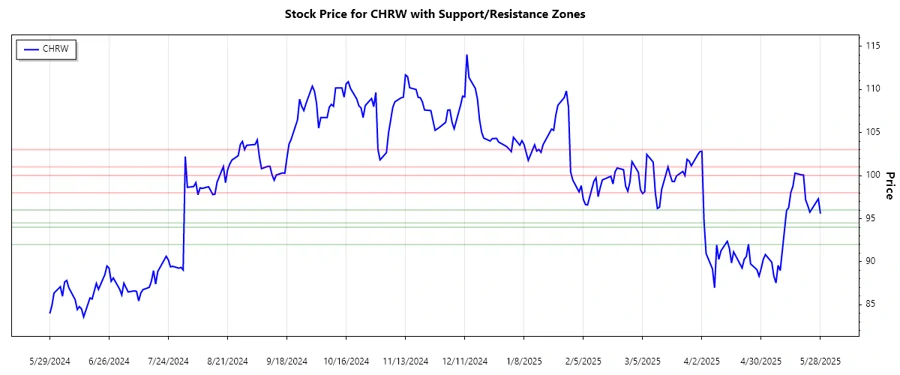
Support and Resistance
To effectively interpret market behavior, identifying support and resistance zones is crucial:
| Zone Type | From | To |
|---|---|---|
| Support 1 | 94.50 | 96.00 |
| Support 2 | 92.00 | 94.00 |
| Resistance 1 | 98.00 | 100.00 |
| Resistance 2 | 101.00 | 103.00 |
The current price circles around the first support zone, indicating a potential rebound or a breakthrough to lower levels.
Conclusion
In summary, C.H. Robinson Worldwide, Inc., currently exhibits a downward trend as indicated by the EMAs, coupled with prices testing the lower support zones. This suggests potential bearish momentum in the near term. However, the proximity of price to support levels also opens opportunities for traders to capitalize on rebounds if bullish pressures resurface. Investors should approach with a balanced strategy, considering both prevailing trends and the potential for reversals in a volatile market.