October 18, 2025 a 05:15 am
CHRW: Fibonacci Analysis - C.H. Robinson Worldwide, Inc.
C.H. Robinson Worldwide, Inc. has shown significant resilience in the freight transportation and logistics industry. The recent trend indicates a robust upward movement, reflecting strong market confidence in the company's operational strategies and financial stability. Investors might view the stock as a potentially rewarding opportunity, considering the company's adaptive strategies in a dynamic market environment. Despite global challenges, the company continues to demonstrate strong fundamentals.
Fibonacci Analysis
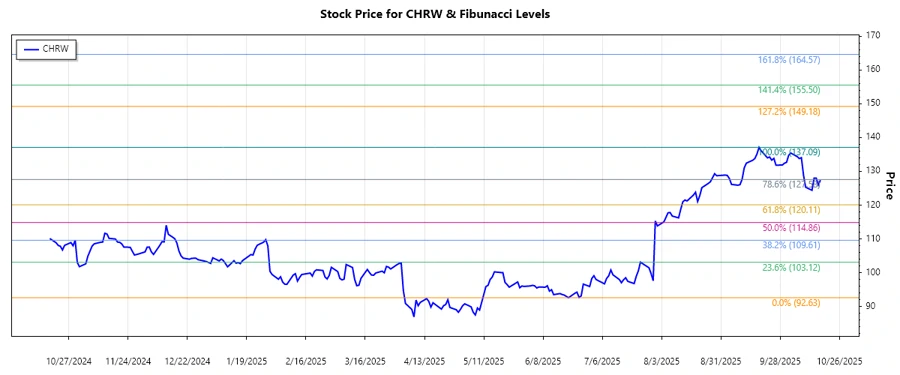
The historical data presents a dominant uptrend in the CHRW stock, starting from a low of $92.63 on 2025-06-20 and reaching a high of $137.09 on 2025-09-18. Based on this trend, the Fibonacci Retracement Levels have been calculated as follows:
| Trend Start Date | Trend End Date | High Price | High Date | Low Price | Low Date |
|---|---|---|---|---|---|
| 2025-06-20 | 2025-09-18 | $137.09 | 2025-09-18 | $92.63 | 2025-06-20 |
| Fibonacci Level | Price Level |
|---|---|
| 0.236 | $127.72 |
| 0.382 | $120.94 |
| 0.5 | $114.86 |
| 0.618 | $108.78 |
| 0.786 | $100.55 |
As of the latest trading date, the stock is at $127.39, which is within the 0.236 Fibonacci Retracement Zone. This suggests a potential support level, indicating that the stock might consolidate at this price before resuming its upward trend.
Conclusion
The CHRW stock has experienced a consistent upward trend, reaffirming its strong market position and operational efficiency. Current price levels coincide with key Fibonacci levels, indicating potential continuity in upward momentum or temporary consolidation. For analysts, this provides a unique opportunity to monitor how external market conditions and internal strategic moves affect future price fluctuations. While the stock shows promise, it is crucial to remain vigilant of potential market volatility and broader economic factors that could impact future performance.
Smart Data Insight
Master the Perfect Entry & Exit for this Stock
Don't leave your profits to chance. Historically, this stock follows specific seasonal patterns that institutional traders use to maximize returns.
- ✅ Identify the "Golden Buying Window"
- ✅ Avoid high-risk correction cycles
- ✅ Backtested data from the last 20+ years