May 21, 2026 a 02:46 am

CHRW: Dividend Analysis - C.H. Robinson Worldwide, Inc.
📊 C.H. Robinson Worldwide, Inc. (CHRW) is known for its robust dividend history, reflecting stability and investor commitment. With a market cap of over $21 billion and a consistent 30-year dividend payment track record, CHRW stands as a resilient choice for dividend-focused investors. While the current dividend yield is relatively modest at 1.39%, it is supported by sustainable payout ratios and positive growth prospects. Additionally, its steady financial footing and prudent capital management practices underline CHRW's reliability as a dividend-paying entity.
Overview
✅ CHRW operates within the logistics and supply chain industry, characterized by a stable yet competitive landscape. Its dividend yield of 1.39% translates into a current dividend per share of USD 2.51, emphasizing a long-term commitment with 30 years of dividend distribution history. Notably, CHRW has not experienced any recent cuts or suspensions in dividends, reflecting the strong financial health and management foresight in safeguarding shareholder payouts.
| Sector | Dividend Yield | Current Dividend per Share | Dividend History | Last Cut or Suspension |
|---|---|---|---|---|
| Logistics & Supply Chain | 1.39% | $2.51 | 30 years | None |
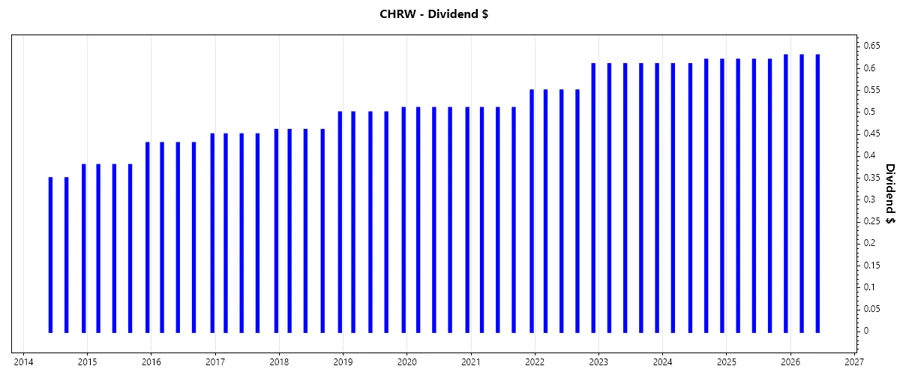
Dividend History
🗣️ The dividend history of a company like CHRW showcases not only its past reliability but also its projected future resilience. Investors often view a consistent dividend history as a testament to a company’s robust financial performance and management acumen, particularly in industries with varying economic cycles.
| Year | Dividend per Share (USD) |
|---|---|
| 2026 | 1.26 |
| 2025 | 2.49 |
| 2024 | 2.46 |
| 2023 | 2.44 |
| 2022 | 2.26 |
Dividend Growth
📈 Dividend growth is a critical indicator of a company's future payout potential and financial health. For CHRW, the dividend growth rates over 3 and 5 years are 3.28% and 4.07% respectively, which are modest yet indicative of steady growth. This stable performance suggests a well-managed company capable of balancing its growth and shareholder returns, a sign of prudent management and reliable cash flow generation.
| Time | Growth |
|---|---|
| 3 years | 3.28% |
| 5 years | 4.07% |
The average dividend growth is 4.07% over 5 years. This shows moderate but steady dividend growth, showcasing CHRW's commitment to increasing shareholder value over time.
Payout Ratio
⚠️ Understanding the payout ratios is crucial for assessing dividend sustainability. CHRW's EPS-based payout ratio stands at 50.13%, while the free cash flow-based ratio is a lesser 34.45%. A payout ratio under 60% is often perceived as sustainable, suggesting CHRW retains a healthy portion of profits for reinvestment, debt reduction, and future growth, making it a structurally sound investment.
| Key Figure Ratio | Percentage |
|---|---|
| EPS-based | 50.13% |
| Free cash flow-based | 34.45% |
CHRW's EPS payout ratio of 50.13% is indicative of a balanced distribution, ensuring ample retained earnings for strategic initiatives, while the 34.45% FCF payout ratio highlights a conservative stance on cash flow management.
Cashflow & Capital Efficiency
✅ Cash flow and capital efficiency are critical to a firm’s financial health and its ability to sustain and grow dividends. CHRW's robust free cash flow yield of 4.03% and earnings yield of 2.77% highlight its profitable cash operations.
| Year | 2025 | 2024 | 2023 |
|---|---|---|---|
| Free Cash Flow Yield | 4.63% | 3.93% | 6.33% |
| Earnings Yield | 3.04% | 3.76% | 3.17% |
| CAPEX to Operating Cash Flow | 2.16% | 4.45% | 11.49% |
| Stock-based Compensation to Revenue | 0.49% | 0.48% | 0.33% |
| Free Cash Flow / Operating Cash Flow Ratio | 97.85% | 95.55% | 88.51% |
The stability of CHRW's cash flows and its moderate investment in capital expenditure indicate efficient capital management. This ensures ongoing capability to maintain dividends while supporting business scalability and innovation.
Balance Sheet & Leverage Analysis
🗣️ Analyzing balance sheet strength and leverage gives insight into the company's financial stability and risk profile. CHRW's debt-to-equity ratio and the net debt to EBITDA indicate leverage within manageable limits, suggesting a balanced approach to financing and growth.
| Year | 2025 | 2024 | 2023 |
|---|---|---|---|
| Debt-to-Equity Ratio | 0.88 | 1.01 | 1.38 |
| Debt-to-Assets Ratio | 0.32 | 0.33 | 0.37 |
| Debt-to-Capital Ratio | 0.47 | 0.50 | 0.58 |
| Net Debt to EBITDA | 1.65 | 2.08 | 2.94 |
| Current Ratio | 1.53 | 1.28 | 1.40 |
| Quick Ratio | 1.53 | 1.28 | 1.40 |
| Financial Leverage | 2.74 | 3.08 | 3.68 |
CHRW's financial position and liquidity indicate robust capability to service debts, with liquidity ratios demonstrating sufficient coverage of short-term obligations, reinforcing investor confidence.
Fundamental Strength & Profitability
📈 High returns and strong profitability margins are indicative of operational excellence. CHRW’s substantial returns on equity and assets signify effective utilization of its resources to generate profits.
| Year | 2025 | 2024 | 2023 |
|---|---|---|---|
| Return on Equity (ROE) | 31.81% | 27.04% | 22.92% |
| Return on Assets (ROA) | 11.61% | 8.79% | 6.22% |
| Net Profit Margin | 3.62% | 2.63% | 1.85% |
| EBIT Margin | 4.84% | 3.78% | 2.92% |
| EBITDA Margin | 5.47% | 4.32% | 3.49% |
| Gross Margin | 8.37% | 7.38% | 6.47% |
| Research & Development to Revenue | 0.05% | 0.25% | 0.00% |
CHRW's profitability metrics combined with controlled costs and capitalization strategies underscore its competitive advantage within its sector, thereby sustaining higher profitability levels.
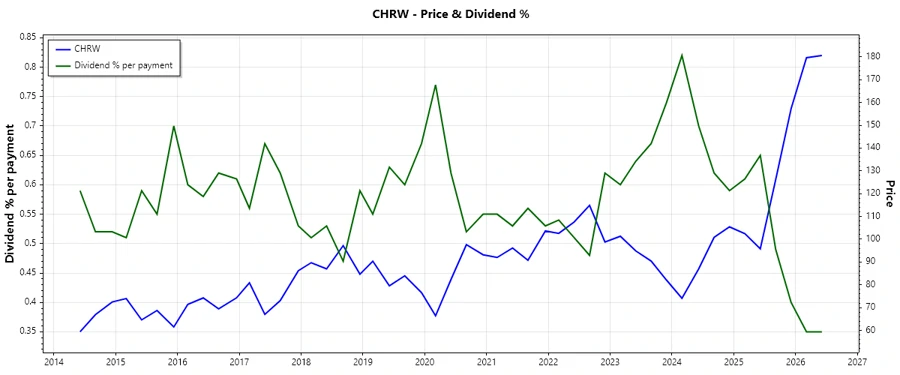
Price Development
Dividend Scoring System
| Criteria | Score (1-5) | Score Bar |
|---|---|---|
| Dividend Yield | 3 | |
| Dividend Stability | 5 | |
| Dividend Growth | 3 | |
| Payout Ratio | 4 | |
| Financial Stability | 4 | |
| Dividend Continuity | 5 | |
| Cashflow Coverage | 4 | |
| Balance Sheet Quality | 4 |
Total Score: 32/40
Rating
✅ Overall, CHRW offers a robust value proposition for dividend investors, marked by a steady yield, excellent dividend history, and sound financial practices. Moderately growing dividends, prudent payout ratios, and stable cash flows create a strong foundation for sustainable shareholder returns. Given the current metrics, CHRW is a reliable candidate for those seeking to enhance income within a balanced portfolio.
Smart Data Insight
Master the Perfect Entry & Exit for this Stock
Don't leave your profits to chance. Historically, this stock follows specific seasonal patterns that institutional traders use to maximize returns.
- ✅ Identify the "Golden Buying Window"
- ✅ Avoid high-risk correction cycles
- ✅ Backtested data from the last 20+ years