May 10, 2026 a 03:30 pm
📊 CHRW: Dividend Analysis - C.H. Robinson Worldwide, Inc.
C.H. Robinson Worldwide, Inc. offers a promising dividend profile with a stable history. With minimal disruptions and continuous growth over the years, it presents an appealing option for income-focused investors. Despite its moderate dividend yield, the company's strong fundamentals and consistent dividend increments make it a sturdy long-term investment.
🗣️ Overview
C.H. Robinson Worldwide, operating in the logistics sector, balances a steady dividend approach with calculated growth. With a dividend yield of 1.46% and a per share dividend of $2.51, the company showcases 30 uninterrupted years of dividend history. The last occurrence of any cut or suspension is notably absent, highlighting robust management of dividend distributions.
| Sector | Dividend Yield | Current Dividend per Share | Dividend History | Last Cut/Suspension |
|---|---|---|---|---|
| Logistics | 1.46% | $2.51 | 30 years | None |
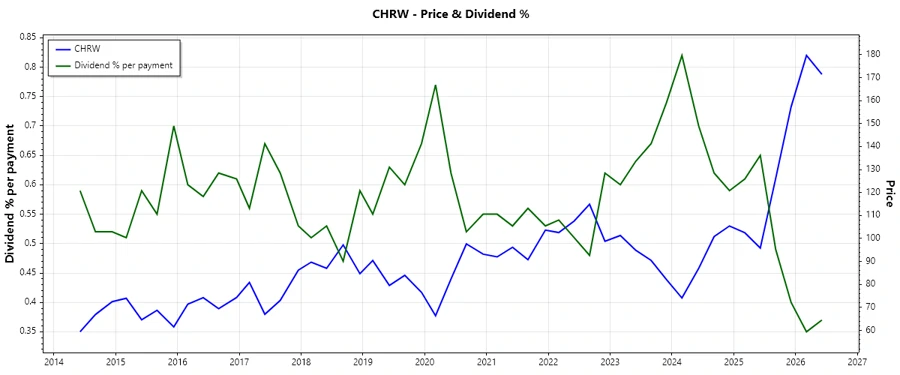
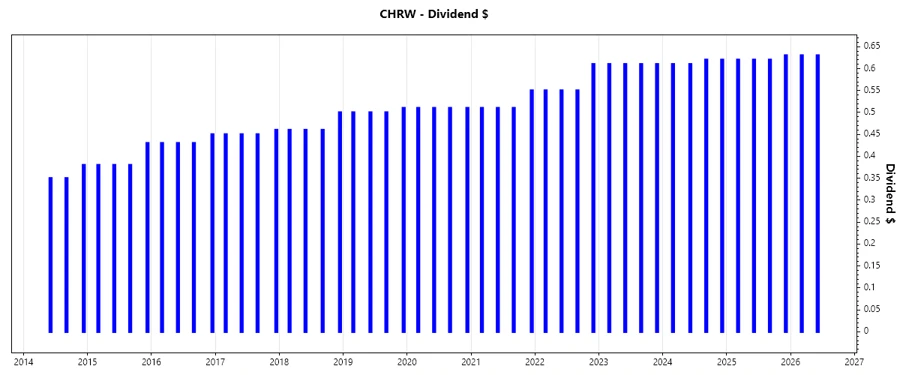
📉 Dividend History
Maintaining a solid dividend history over 30 years underscores the resilience and reliability of C.H. Robinson Worldwide. Consistent annual payments reflect the company's financial health and commitment to shareholder value, crucial for income-seeking investors.
| Year | Dividend per Share (USD) |
|---|---|
| 2026 | 1.26 |
| 2025 | 2.49 |
| 2024 | 2.46 |
| 2023 | 2.44 |
| 2022 | 2.26 |
📈 Dividend Growth
The growth in dividends reflects strategic reinvestment and profit distribution policies of the company. Understanding these trends helps in predicting future payout potential and stability.
| Time | Growth |
|---|---|
| 3 years | 3.28% |
| 5 years | 4.07% |
The average dividend growth is 4.07% over 5 years. This shows moderate but steady dividend growth.
✅ Payout Ratio
The payout ratio provides insight into the sustainability of dividend payments. A moderate ratio can indicate a balance between rewarding shareholders and retaining capital for growth.
| Key Figure | Ratio |
|---|---|
| EPS-based | 50.13% |
| Free cash flow-based | 34.45% |
With an EPS-based payout ratio at 50.13% and a FCF-based ratio at 34.45%, C.H. Robinson preserves a good balance, allowing ample room for reinvestment and buffer for unexpected downturns.
Cashflow & Capital Efficiency
Evaluating cash flow and capital efficiency is crucial for understanding a firm's capacity to sustain dividends and fund future growth. Indicators such as free cash flow yield and CAPEX efficiency provide insight into financial health.
| Year | 2025 | 2024 | 2023 |
|---|---|---|---|
| Free Cash Flow Yield | 4.63% | 3.93% | 6.33% |
| Earnings Yield | 3.04% | 3.76% | 3.17% |
| CAPEX to Operating Cash Flow | 2.15% | 4.45% | 11.49% |
| Stock-based Compensation to Revenue | 0.49% | 0.48% | 0.33% |
| Free Cash Flow / Operating Cash Flow Ratio | 97.85% | 95.55% | 88.51% |
Strong free cash flow yield highlights C.H. Robinson's capacity to fund dividends and growth without financial strain. CAPEX remains prudent, ensuring liquidity for other operational needs.
Balance Sheet & Leverage Analysis
A thorough balance sheet analysis reveals a company's leverage and financial stability. Ratios such as debt-to-equity reflect debt levels relative to equity, crucial for assessing long-term solvency.
| Year | 2025 | 2024 | 2023 |
|---|---|---|---|
| Debt-to-Equity | 88.27% | 101.11% | 137.63% |
| Debt-to-Assets | 32.21% | 32.86% | 37.37% |
| Debt-to-Capital | 46.88% | 50.28% | 57.92% |
| Net Debt to EBITDA | 1.65 | 2.08 | 2.94 |
| Current Ratio | 1.53 | 1.28 | 1.40 |
| Quick Ratio | 1.53 | 1.28 | 1.40 |
| Financial Leverage | 2.74 | 3.08 | 3.68 |
The financial health of C.H. Robinson is underscored by its manageable debt levels and consistent liquidity ratios, supporting its capacity to sustain dividends and invest in growth.
Fundamental Strength & Profitability
Profitability ratios provide insight into a company's operational efficiency and overall financial health. These metrics are critical for assessing long-term growth potential and return on investment.
| Year | 2025 | 2024 | 2023 |
|---|---|---|---|
| Return on Equity | 31.81% | 27.04% | 22.92% |
| Return on Assets | 11.61% | 8.79% | 6.22% |
| Margins: Net | 3.62% | 2.63% | 1.85% |
| EBIT | 4.84% | 3.78% | 2.92% |
| EBITDA | 5.47% | 4.32% | 3.49% |
| Gross | 8.37% | 7.38% | 6.47% |
| R&D to Revenue | 0.084% | 0.25% | 0% |
C.H. Robinson showcases strong profitability metrics, with steady ROE and improving margins, underscoring robust core operations and revenue generation capacity.
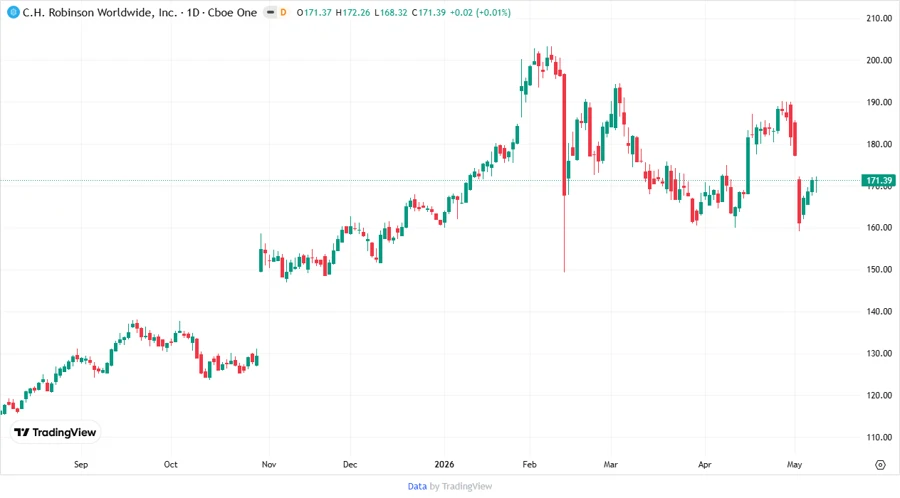
Price Development
Dividend Scoring System
| Category | Score (1-5) | Score Bar |
|---|---|---|
| Dividend yield | 3 | |
| Dividend Stability | 5 | |
| Dividend growth | 4 | |
| Payout ratio | 4 | |
| Financial stability | 4 | |
| Dividend continuity | 5 | |
| Cashflow Coverage | 4 | |
| Balance Sheet Quality | 4 |
Total Score: 33/40
Rating
In summary, C.H. Robinson Worldwide, Inc. provides a compelling dividend proposition. With solid growth, reliable payment history, and commendable financial management, it emerges as a preferable choice for consistent dividend income, particularly for investors valuing stability and moderate growth.
Smart Data Insight
Master the Perfect Entry & Exit for this Stock
Don't leave your profits to chance. Historically, this stock follows specific seasonal patterns that institutional traders use to maximize returns.
- ✅ Identify the "Golden Buying Window"
- ✅ Avoid high-risk correction cycles
- ✅ Backtested data from the last 20+ years