
March 22, 2026 a 03:30 am



CHRW: Dividend Analysis - C.H. Robinson Worldwide, Inc.
C.H. Robinson Worldwide, Inc. stands as a solid contender for long-term dividend-focused investors, offering consistent dividend payouts for 30 consecutive years. The company's diversified sector presence aids in maintaining a stable dividend yield, albeit modest, underscoring its resilience in fluctuating market conditions. However, the growth trajectory appears conservative, warranting close observation of its strategic reinvestment plans.
📊 Overview
C.H. Robinson operates within the transportation and logistics sector, which inherently faces both cyclical and competitive pressures. Despite these challenges, it boasts an impressive 30-year dividend payment history without any recent cuts or suspensions, reflecting strong financial stewardship.
| Parameter | Value |
|---|---|
| Sector | Transportation & Logistics |
| Dividend Yield | 1.39% |
| Current Dividend per Share | $2.51 USD |
| Dividend History | 30 years |
| Last Cut or Suspension | None |
🗣️ Dividend History
Maintaining a consistent dividend payment history over 30 years demonstrates C.H. Robinson's commitment to shareholder returns. This impressive track record provides reassurance about the firm’s operational and financial stability even during economic downturns. Investors favor companies with proven dividend reliability.
| Year | Dividend per Share (USD) |
|---|---|
| 2026 | 0.63 |
| 2025 | 2.49 |
| 2024 | 2.46 |
| 2023 | 2.44 |
| 2022 | 2.26 |
📈 Dividend Growth
Understanding dividend growth is crucial for investors seeking income growth over time. C.H. Robinson's recent dividend growth rates reflect a balanced approach between rewarding investors and reinvesting in the business for future growth potential.
| Time | Growth |
|---|---|
| 3 years | 3.28% |
| 5 years | 4.07% |
The average dividend growth is 4.07% over 5 years. This shows moderate but steady dividend growth, suggesting the company prefers gradual enhancements in shareholder returns while maintaining financial flexibility.
🔍 Payout Ratio
The payout ratio is a critical metric to evaluate dividend sustainability. It reflects the proportion of earnings distributed as dividends. C.H. Robinson's payout ratios indicate a well-balanced policy, allowing for both investor payouts and reinvestment into the company.
| Key figure | Ratio |
|---|---|
| EPS-based | 51.18% |
| Free Cash Flow-based | 33.22% |
The EPS payout ratio of 51.18% and FCF payout of 33.22% suggest a prudent distribution strategy, balancing shareholder returns with business investments. These figures signal financial discipline and dividend sustainability.
💵 Cashflow & Capital Efficiency
Efficient management of cash flow and capital deployment is vital for ongoing dividend sustainability and growth potential. Evaluating these metrics provides insights into management’s financial acuity.
| Metric | 2025 | 2024 | 2023 |
|---|---|---|---|
| Free Cash Flow Yield | 4.63% | 3.93% | 6.33% |
| Earnings Yield | 3.04% | 3.76% | 3.17% |
| CAPEX to Operating Cash Flow | 2.15% | 4.45% | 11.49% |
| Stock-based Compensation to Revenue | 0.49% | 0.48% | 0.33% |
| Free Cash Flow / Operating Cash Flow Ratio | 97.85% | 95.55% | 88.51% |
The strong cash flow performance and effective capital allocation are indicative of solid financial management. This ensures a robust buffer for handling economic fluctuations, supporting both operational needs and dividend commitments.
⚔️ Balance Sheet & Leverage Analysis
Analyzing the balance sheet ratios provides a deeper understanding of C.H. Robinson’s leverage and liquidity positions, crucial for evaluating its ability to sustain dividends during distress periods.
| Metric | 2025 | 2024 | 2023 |
|---|---|---|---|
| Debt-to-Equity | 0.88 | 1.01 | 1.38 |
| Debt-to-Assets | 0.32 | 0.33 | 0.37 |
| Debt-to-Capital | 0.47 | 0.50 | 0.58 |
| Net Debt to EBITDA | 1.65 | 2.08 | 2.94 |
| Current Ratio | 1.53 | 1.28 | 1.40 |
| Quick Ratio | 1.53 | 1.28 | 1.40 |
| Financial Leverage | 2.74 | 3.08 | 3.68 |
The level of financial leverage and strong liquidity positions underscore C.H. Robinson's prudent balance sheet management, boosting its ability to meet short-term obligations and reduce financial risk.
🌟 Fundamental Strength & Profitability
Profitability ratios highlight the company's capability to generate profits efficiently; a strong profitability profile profoundly influences its dividend paying capability.
| Metric | 2025 | 2024 | 2023 |
|---|---|---|---|
| Return on Equity | 31.81% | 27.04% | 22.92% |
| Return on Assets | 11.61% | 8.79% | 6.22% |
| Net Margin | 3.62% | 2.63% | 1.85% |
| EBIT Margin | 4.84% | 3.78% | 2.92% |
| EBITDA Margin | 5.47% | 4.32% | 3.49% |
| Gross Margin | 8.37% | 7.38% | 6.47% |
| Research & Development to Revenue | 0.0% | 0.25% | 0.0% |
C.H. Robinson's strong return metrics and efficient margin profiles suggest a well-managed business structure that supports its capacity to sustain and potentially grow dividends.
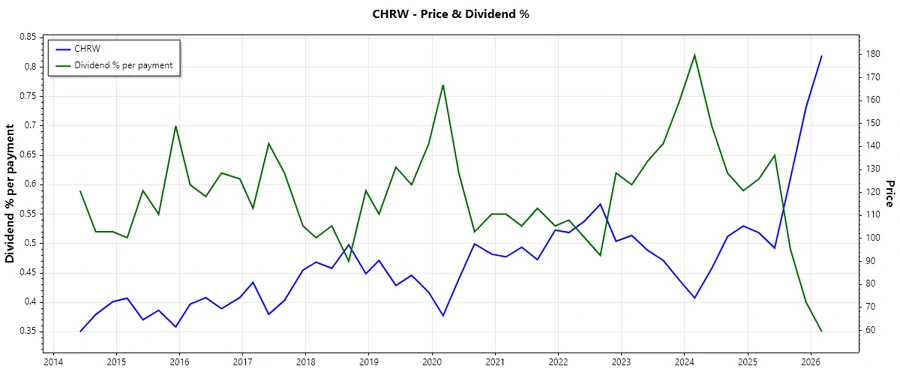
📉 Price Development
✅ Dividend Scoring System
| Category | Score (1-5) | Indicator |
|---|---|---|
| Dividend Yield | 3 | |
| Dividend Stability | 5 | |
| Dividend Growth | 3 | |
| Payout Ratio | 4 | |
| Financial Stability | 4 | |
| Dividend Continuity | 5 | |
| Cashflow Coverage | 4 | |
| Balance Sheet Quality | 4 |
Total Score: 32/40
⚠️ Rating
Based on the analysis, C.H. Robinson Worldwide, Inc. presents itself as a reliable dividend-paying entity with a strong history of paying dividends consistently. Despite showing moderate growth, its robust financial metrics and comprehensive dividend strategy make it a worthwhile consideration for income-focused investors. Continued performance monitoring and sectoral dynamics should be taken into account for future dividend prospects.
Smart Data Insight
Master the Perfect Entry & Exit for this Stock
Don't leave your profits to chance. Historically, this stock follows specific seasonal patterns that institutional traders use to maximize returns.
- ✅ Identify the "Golden Buying Window"
- ✅ Avoid high-risk correction cycles
- ✅ Backtested data from the last 20+ years