March 18, 2026 a 02:46 am

CHRW: Dividend Analysis - C.H. Robinson Worldwide, Inc.
C.H. Robinson Worldwide, Inc., a leader in the logistics and transportation industry, presents a promising investment opportunity with its consistent dividend history and substantial market presence. The company's disciplined financial management and strategic growth initiatives support a sustainable dividend policy. As a steadfast performer, C.H. Robinson offers value to shareholders seeking reliability and gradual dividend growth.
📊 Overview
The fundamental strength of C.H. Robinson Worldwide, Inc., is reflected in its sector, operational performance, and stable dividends, making it a potential cornerstone for any income-focused portfolio.
| Metric | Value |
|---|---|
| Sector | Logistics and Transportation |
| Dividend Yield | 1.39% |
| Current Dividend Per Share | 2.51 USD |
| Dividend History | 30 years |
| Last Cut or Suspension | None |
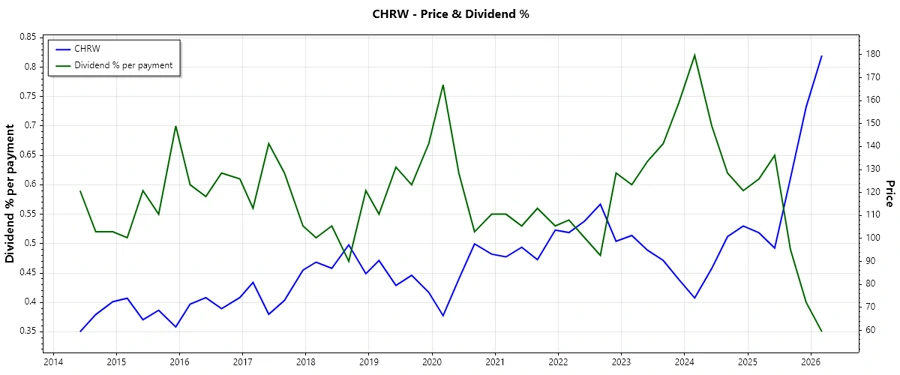
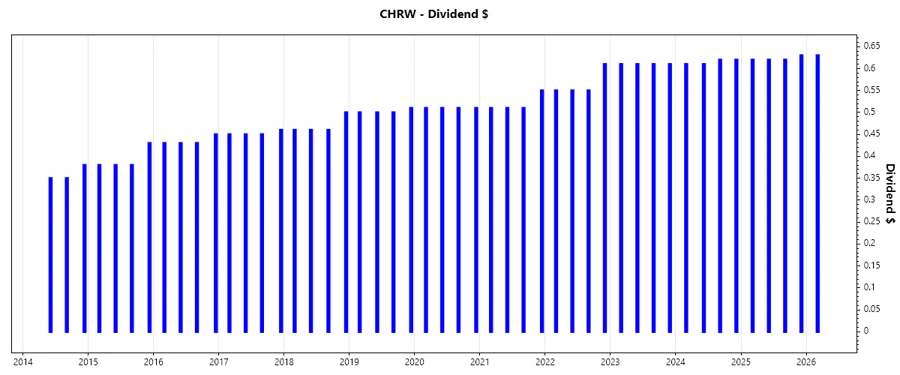
🗣️ Dividend History
C.H. Robinson has demonstrated consistent dividend payments across three decades, a testament to their robust financial strategy and resilience to market dynamics.
| Year | Dividend Per Share (USD) |
|---|---|
| 2026 | 0.63 |
| 2025 | 2.49 |
| 2024 | 2.46 |
| 2023 | 2.44 |
| 2022 | 2.26 |
📈 Dividend Growth
The dividend growth of C.H. Robinson underscores their capacity to enhance shareholder returns, reflecting their commitment to financial health and operational success.
| Time | Growth |
|---|---|
| 3 years | 3.28% |
| 5 years | 4.07% |
The average dividend growth is 4.07% over 5 years. This shows moderate but steady dividend growth.
✅ Payout Ratio
The payout ratios contribute to assessing dividend safety. C.H. Robinson employs a balanced approach, enabling sustainability and future growth potential.
| Key Figure | Ratio |
|---|---|
| EPS-based | 51.18% |
| Free Cash Flow-based | 33.22% |
The current EPS payout ratio of 51.18% and FCF payout ratio of 33.22% indicate a healthy balance between rewarding shareholders and retaining earnings for reinvestment.
💰 Cashflow & Capital Efficiency
Analyzing C.H. Robinson's cash flow dynamics reveals insights into operating efficiency and capital allocation, critical for understanding their financial viability.
| Year | 2025 | 2024 | 2023 |
|---|---|---|---|
| Free Cash Flow Yield | 4.63% | 3.93% | 6.33% |
| Earnings Yield | 3.04% | 3.76% | 3.17% |
| CAPEX to Operating Cash Flow | 2.15% | 4.45% | 11.49% |
| Stock-based Compensation to Revenue | 0.49% | 0.48% | 0.33% |
| Free Cash Flow / Operating Cash Flow Ratio | 97.85% | 95.55% | 88.51% |
C.H. Robinson's robust cash flow management reflects their operational efficiency and potential for sustainable capital returns to investors.
🔍 Balance Sheet & Leverage Analysis
Understanding the balance sheet metrics, including leverage ratios, provides insight into the company's long-term financial sustainability and risk profile.
| Year | 2025 | 2024 | 2023 |
|---|---|---|---|
| Debt-to-Equity | 0.88 | 1.01 | 1.38 |
| Debt-to-Assets | 0.32 | 0.33 | 0.37 |
| Debt-to-Capital | 0.47 | 0.50 | 0.58 |
| Net Debt to EBITDA | 1.65 | 2.08 | 2.94 |
| Current Ratio | 1.53 | 1.28 | 1.40 |
| Quick Ratio | 1.53 | 1.28 | 1.40 |
The financial leverage and liquidity positions suggest C.H. Robinson's capability to manage its obligations effectively.
📉 Fundamental Strength & Profitability
Key profitability ratios demonstrate the company's ability to generate earnings from equity and assets, crucial for evaluating dividend health and growth prospects.
| Year | 2025 | 2024 | 2023 |
|---|---|---|---|
| Return on Equity | 31.81% | 27.04% | 22.92% |
| Return on Assets | 11.61% | 8.79% | 6.22% |
| Net Margin | 3.62% | 2.63% | 1.85% |
| EBIT Margin | 4.84% | 3.78% | 2.92% |
| EBITDA Margin | 5.47% | 4.32% | 3.49% |
| Gross Margin | 8.37% | 7.38% | 6.47% |
The superior profitability metrics solidify C.H. Robinson's standing as a strong player in its sector, providing ample cushion for dividend distributions.
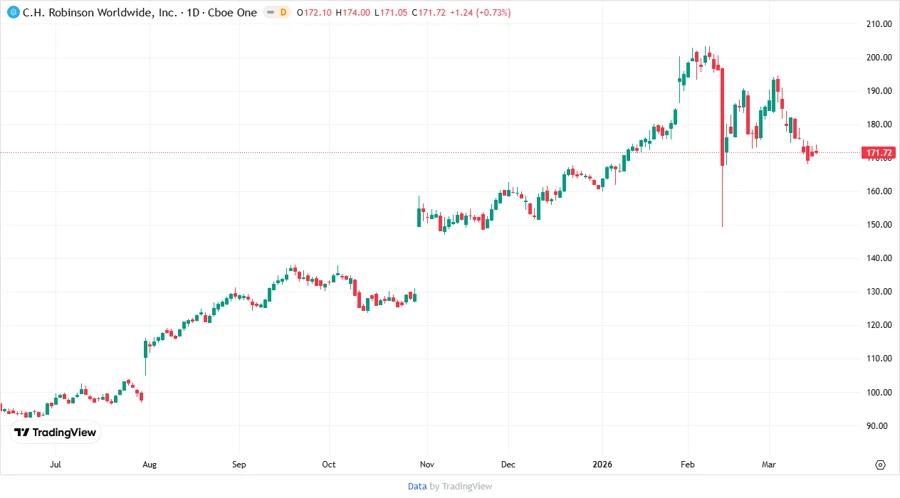
📈 Price Development
✔️ Dividend Scoring System
| Criteria | Score | Bar |
|---|---|---|
| Dividend Yield | 4 | |
| Dividend Stability | 5 | |
| Dividend Growth | 3 | |
| Payout Ratio | 4 | |
| Financial Stability | 4 | |
| Dividend Continuity | 5 | |
| Cashflow Coverage | 4 | |
| Balance Sheet Quality | 4 |
Total Score: 33/40
⚠️ Rating
C.H. Robinson Worldwide, Inc. is a robust contender in the logistics sector, with a commendable dividend policy, sound financial metrics, and a deeply rooted stability. Investors seeking reliable income streams with growth potential should consider this stock, despite its moderate dividend yield, owing to its high continuity and stability scores.
Smart Data Insight
Master the Perfect Entry & Exit for this Stock
Don't leave your profits to chance. Historically, this stock follows specific seasonal patterns that institutional traders use to maximize returns.
- ✅ Identify the "Golden Buying Window"
- ✅ Avoid high-risk correction cycles
- ✅ Backtested data from the last 20+ years