November 24, 2025 a 07:31 am


CHRW: Dividend Analysis - C.H. Robinson Worldwide, Inc.
C.H. Robinson Worldwide, Inc. presents a robust dividend profile with a consistent payment history over 29 years. The company's strategic financial management has allowed for a steady growth rate of its dividends, making it an attractive option for income-focused investors. Despite economic fluctuations, CHRW maintains resilience in sustaining its dividend payouts, showcasing financial stability and shareholder value commitment.
📊 Overview
CHRW operates in a competitive sector, yet demonstrates strong financial management reflected in its dividend yield and payout history.
| Metric | Value |
|---|---|
| Sector | Transportation Services |
| Dividend yield | 1.64% |
| Current dividend per share | 2.46 USD |
| Dividend history | 29 years |
| Last cut or suspension | 2011 |
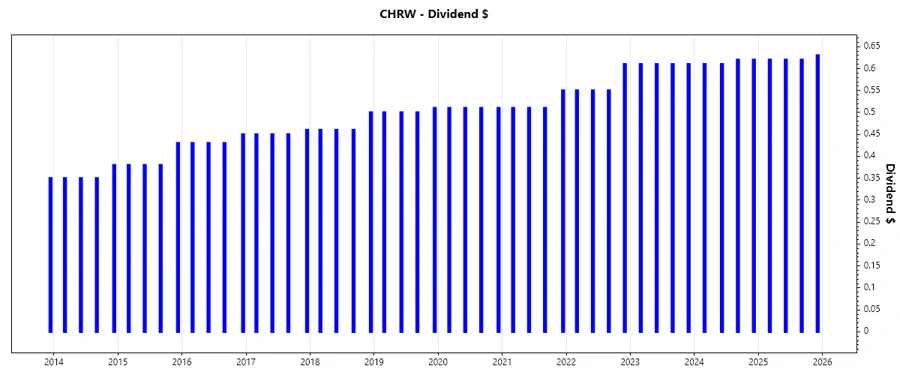
🗣️ Dividend History
The dividend history of CHRW reflects a stable and growing commitment to returning value to shareholders. Maintaining consistency in dividend payments over the years is a critical indicator of financial health and shareholder value.
| Year | Dividend per Share (USD) |
|---|---|
| 2025 | 2.49 |
| 2024 | 2.46 |
| 2023 | 2.44 |
| 2022 | 2.26 |
| 2021 | 2.08 |
📈 Dividend Growth
The dividend growth rate of CHRW over the past few years illustrates the company's commitment to steadily increasing shareholder returns, even in fluctuating market conditions.
| Time | Growth |
|---|---|
| 3 years | 5.75% |
| 5 years | 4.12% |
The average dividend growth is 4.12% over 5 years. This shows moderate but steady dividend growth.
📉 Payout Ratio
The payout ratio is an essential measure to determine the sustainability of dividends. CHRW's healthy payout ratios ensure dividends are well covered by earnings and cash flows.
| Key figure | Ratio |
|---|---|
| EPS-based | 49.35% |
| Free cash flow-based | 33.89% |
With a payout ratio of 49.35% (EPS) and 33.89% (FCF), CHRW demonstrates a conservative and sustainable dividend policy, allowing room for growth and financial cushioning.
✅ Cashflow & Capital Efficiency
Cash flow management is crucial for dividend sustainability. CHRW showcases a solid cash flow foundation, ensuring continued investments and shareholder returns.
| Metric | 2024 | 2023 | 2022 |
|---|---|---|---|
| Free Cash Flow Yield | 3.93% | 6.33% | 13.22% |
| Earnings Yield | 3.76% | 3.17% | 8.17% |
| CAPEX to Operating Cash Flow | 4.45% | 11.49% | 7.79% |
| Stock-based Compensation to Revenue | 0.48% | 0.33% | 0.37% |
| Free Cash Flow / Operating Cash Flow Ratio | 95.55% | 88.51% | 92.21% |
CHRW's efficient cash management ensures the availability of resources for strategic initiatives and consistent dividend payouts.
💰 Balance Sheet & Leverage Analysis
Strong leverage and liquidity ratios are vital indicators of a company's ability to meet its financial obligations and sustain operations.
| Metric | 2024 | 2023 | 2022 |
|---|---|---|---|
| Debt-to-Equity | 1.01 | 1.38 | 1.74 |
| Debt-to-Assets | 32.86% | 37.37% | 39.65% |
| Debt-to-Capital | 50.28% | 57.92% | 63.56% |
| Net Debt to EBITDA | 2.08 | 2.94 | 1.58 |
| Current Ratio | 1.28 | 1.40 | 1.08 |
| Quick Ratio | 1.28 | 1.40 | 1.08 |
| Financial Leverage | 3.08 | 3.68 | 4.40 |
CHRW maintains a manageable debt load relative to its equity, ensuring long-term financial health and operational flexibility.
🌟 Fundamental Strength & Profitability
Assessing profitability and operational efficiency helps identify how well CHRW is performing relative to its resources and market position.
| Metric | 2024 | 2023 | 2022 |
|---|---|---|---|
| Return on Equity | 27.04% | 22.92% | 69.49% |
| Return on Assets | 8.79% | 6.22% | 15.80% |
| Margins: Net | 2.63% | 1.85% | 3.81% |
| EBIT | 3.78% | 2.92% | 5.13% |
| EBITDA | 4.32% | 3.49% | 5.51% |
| Gross | 7.38% | 6.47% | 7.57% |
| R&D to Revenue | 0.25% | 0.00% | 0.00% |
CHRW demonstrates high efficiency and returns relative to its assets and equity, which is indicative of strong underlying business fundamentals.
📊 Price Development
✅ Dividend Scoring System
| Criteria | Score | |
|---|---|---|
| Dividend yield | 3 | |
| Dividend Stability | 4 | |
| Dividend growth | 3 | |
| Payout ratio | 4 | |
| Financial stability | 4 | |
| Dividend continuity | 5 | |
| Cashflow Coverage | 5 | |
| Balance Sheet Quality | 4 |
Total Score: 32/40
⚠️ Rating
CHRW displays a solid dividend payout strategy backed by strong cash flow and stability in operations. While the yield might not be the highest, the company's ability to sustain and grow its dividends makes it a viable choice for long-term income investors. Careful consideration should be given to industry conditions, but the overall financial health and strategic decisions of C.H. Robinson Worldwide, Inc. make it an attractive option in a diversified income portfolio.
Smart Data Insight
Master the Perfect Entry & Exit for this Stock
Don't leave your profits to chance. Historically, this stock follows specific seasonal patterns that institutional traders use to maximize returns.
- ✅ Identify the "Golden Buying Window"
- ✅ Avoid high-risk correction cycles
- ✅ Backtested data from the last 20+ years