August 16, 2025 a 07:31 am


CHRW: Dividend Analysis - C.H. Robinson Worldwide, Inc.
C.H. Robinson Worldwide, Inc. offers a robust dividend profile with a consistent history of payouts over the past 29 years. Its moderate dividend yield of 2.05% suggests a stable income for investors while maintaining a healthy balance between payout and retained earnings. The absence of recent dividend cuts underscores management's commitment to rewarding shareholders. Investors could find the company's long-term growth of dividends appealing.
📊 Overview
C.H. Robinson operates within a sector known for stability and regular cash flows: Industrials. Such characteristics often support reliable dividend distributions. The company's 2.05% dividend yield compares favorably within its sector. Additionally, with a consistent 29-year dividend history and no recent cuts, investors can expect a resilient income stream.
| Metric | Value |
|---|---|
| Sector | Industrials |
| Dividend Yield | 2.05% |
| Current Dividend per Share | 2.46 USD |
| Dividend History | 29 years |
| Last Cut or Suspension | None |
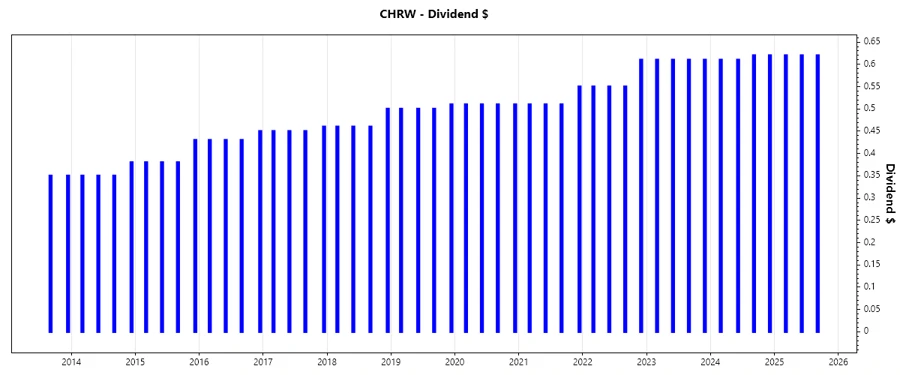
🗣️ Dividend History
The dividend history showcases the company's commitment to maintaining and gradually increasing dividends. Such consistency is a key indicator of financial stability. Investors value this track record, as it demonstrates management's reliability in returning value to shareholders.
| Year | Dividend per Share (USD) |
|---|---|
| 2025 | 1.86 |
| 2024 | 2.46 |
| 2023 | 2.44 |
| 2022 | 2.26 |
| 2021 | 2.08 |
📈 Dividend Growth
The growth in dividends over time reflects the increasing profitability and improving cash flow generation of the company. Over the last 5 years, the dividend has grown at an average rate of 4.12%, indicating a stable but not overly aggressive growth strategy.
| Time | Growth |
|---|---|
| 3 years | 5.75% |
| 5 years | 4.12% |
The average dividend growth is 4.12% over 5 years. This shows moderate but steady dividend growth.
✅ Payout Ratio
Payout ratios provide insights into how much profit is returned to shareholders relative to earnings and cash flow. A 55.54% EPS-based payout ratio indicates sufficient reinvestment in the business while maintaining shareholder returns. Similarly, the FCF payout ratio of 42.79% suggests dividend payments are well-covered by free cash flow, ensuring sustainability.
| Key figure | Ratio |
|---|---|
| EPS-based | 55.54% |
| Free cash flow-based | 42.79% |
💸 Cashflow & Capital Efficiency
Maintaining a healthy cash flow is vital for operational efficiency and continued dividend payments. C.H. Robinson demonstrates effective cash utilization with a high Free Cash Flow/Operating Cash Flow ratio, suggesting ample liquidity to support dividend policies. Capital efficiency metrics like Free Cash Flow Yield also indicate sound financial management, with returns like ROIC reflecting efficient capital deployment.
| Metric | 2024 | 2023 | 2022 |
|---|---|---|---|
| Free Cash Flow Yield | 3.93% | 6.33% | 13.22% |
| Earnings Yield | 3.76% | 3.17% | 8.17% |
| CAPEX to Operating Cash Flow | 4.45% | 11.49% | 7.79% |
| Stock-based Compensation to Revenue | 0.48% | 0.33% | 0.37% |
| Free Cash Flow / Operating Cash Flow Ratio | 95.55% | 88.51% | 92.21% |
⚖️ Balance Sheet & Leverage Analysis
Assessing leverage and balance sheet strength is crucial for understanding financial resilience. C.H. Robinson maintains a reasonable debt profile with manageable ratios, supporting continued dividends and potential for growth. The quick ratio supports adequate short-term liquidity, whereas debt metrics suggest controlled leverage levels.
| Metric | 2024 | 2023 | 2022 |
|---|---|---|---|
| Debt-to-Equity | 1.01 | 1.38 | 1.74 |
| Debt-to-Assets | 32.86% | 37.37% | 39.65% |
| Debt-to-Capital | 50.28% | 57.92% | 63.56% |
| Net Debt to EBITDA | 2.09 | 2.94 | 1.58 |
| Current Ratio | 1.28 | 1.40 | 1.08 |
📉 Fundamental Strength & Profitability
The company demonstrates solid profitability metrics with strong margins and returns. Efficient use of assets and equity is evident in the robust Return on Equity figures. Sustained margins across various profitability measures reflect a competitive edge and effective cost management.
| Metric | 2024 | 2023 | 2022 |
|---|---|---|---|
| Return on Equity | 27.04% | 22.92% | 69.49% |
| Return on Assets | 8.79% | 6.22% | 15.80% |
| Net Margin | 2.63% | 1.85% | 3.81% |
| EBIT Margin | 3.78% | 2.92% | 5.13% |
| EBITDA Margin | 4.30% | 3.49% | 5.51% |
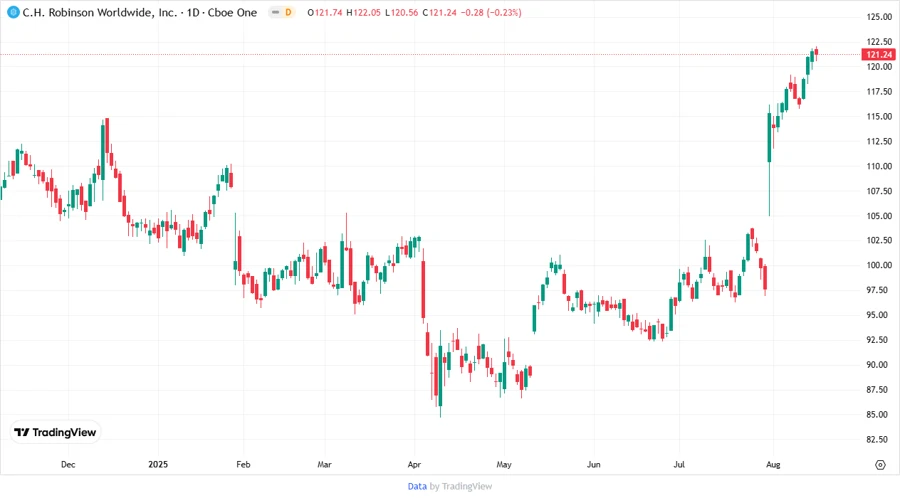
📊 Price Development
🏆 Dividend Scoring System
| Criteria | Score | Score Bar |
|---|---|---|
| Dividend yield | 4 | |
| Dividend Stability | 5 | |
| Dividend growth | 3 | |
| Payout ratio | 4 | |
| Financial stability | 4 | |
| Dividend continuity | 5 | |
| Cashflow Coverage | 4 | |
| Balance Sheet Quality | 3 |
Total Score: 32/40
⭐ Rating
Based on a comprehensive analysis, C.H. Robinson Worldwide, Inc. presents a solid investment opportunity for dividend-focused investors. The company excels in maintaining history of consistent dividends, youth growth, and stable financial metrics. It offers a balanced approach with sufficient returns to shareholders while ensuring reinvestment for future growth. Conclusively, C.H. Robinson Worldwide, Inc. is a reliable choice for long-term dividend investors.
Smart Data Insight
Master the Perfect Entry & Exit for this Stock
Don't leave your profits to chance. Historically, this stock follows specific seasonal patterns that institutional traders use to maximize returns.
- ✅ Identify the "Golden Buying Window"
- ✅ Avoid high-risk correction cycles
- ✅ Backtested data from the last 20+ years