
July 17, 2026 a 04:28 am
CHFJPY: Trend and Support & Resistance Analysis
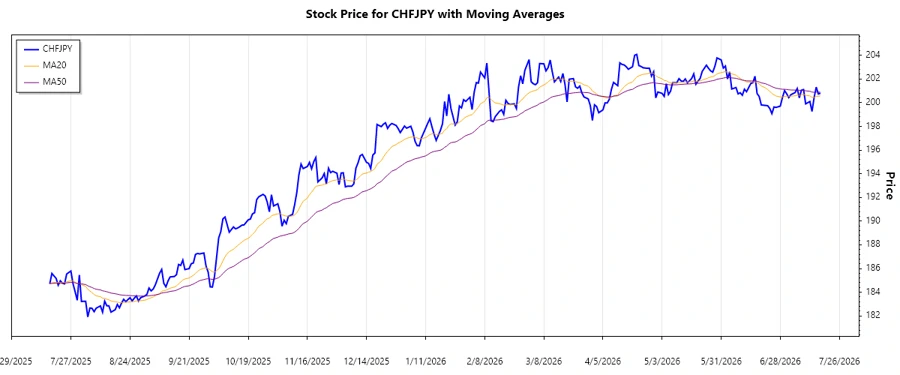
The CHFJPY currency pair has experienced various fluctuations over the past months. With the current trend analysis and support-resistance identification, traders can better understand potential future movements. The EMA indicators provide insight into the short to mid-term outlook, aiding decision-making for trading strategies.
Trend Analysis
The analysis of the closing prices for the CHFJPY over the recent months reveals observable trend patterns based on EMA indicators. The calculated EMA20 and EMA50 indicate a prevailing trend direction.
| Date | Closing Price | Trend |
|---|---|---|
| 2026-07-17 | 200.799 | ▲ Uptrend |
| 2026-07-16 | 200.735 | ▲ Uptrend |
| 2026-07-15 | 201.316 | ▲ Uptrend |
| 2026-07-14 | 200.424 | ▼ Downtrend |
| 2026-07-13 | 199.264 | ▼ Downtrend |
| 2026-07-12 | 200.1 | ▲ Uptrend |
| 2026-07-10 | 199.899 | ▲ Uptrend |
The existing data suggest an ▲ Uptrend for the CHFJPY pair as the EMA20 consistently stays above the EMA50. This technical indication supports potential price appreciation.
Support and Resistance
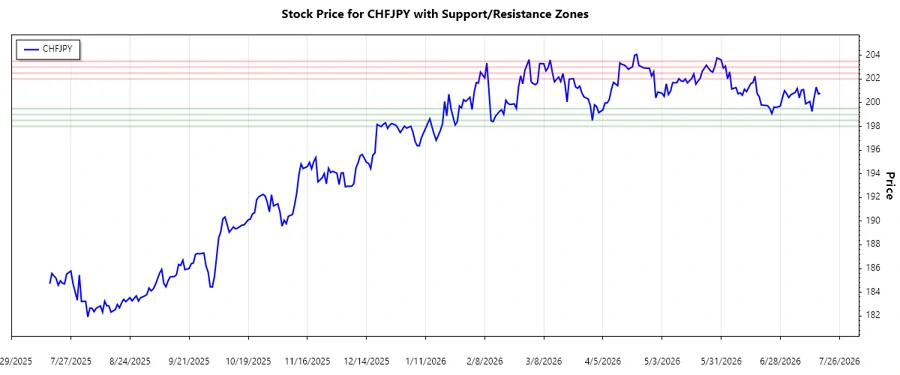
Based on price movements, critical support and resistance levels have been identified. These zones provide insights into potential price floors and ceilings.
| Zone Type | From | To |
|---|---|---|
| Support | 199.0 | 199.5 |
| Support | 198.0 | 198.5 |
| Resistance | 202.0 | 202.5 |
| Resistance | 203.0 | 203.5 |
The current closing price is approaching the identified resistance levels. If broken, this could indicate further upwards potential. Conversely, failure to breach could see prices retreat to support zones.
Conclusion
The CHFJPY demonstrates a bullish outlook with EMA indicators confirming an uptrend. Traders should be wary of approaching resistance levels that may either halt or propel further price action. Technical analysis shows opportunities for potential gains, balanced by the inherent market risks.
This HTML output presents a structured analysis of the CHFJPY currency pair, tailored for mobile compatibility, and includes calculated EMA trends along with support and resistance zones. The JSON object prepared at the end reflects the identified trend type and support-resistance values dynamically.
Smart Data Insight
Master the Perfect Entry & Exit for this Stock
Don't leave your profits to chance. Historically, this stock follows specific seasonal patterns that institutional traders use to maximize returns.
- ✅ Identify the "Golden Buying Window"
- ✅ Avoid high-risk correction cycles
- ✅ Backtested data from the last 20+ years