December 14, 2025 a 04:28 am


CHFJPY: Trend and Support & Resistance Analysis
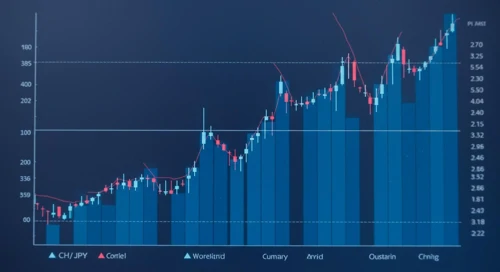
The CHFJPY currency pair has exhibited notable fluctuations, indicating a distinct trend over the recent months. This analysis explores the current trend direction, whether an upward or downward trajectory has been established based on moving averages. Identifying significant support and resistance zones will provide insight into potential price barriers. This report provides a comprehensive technical outlook to enhance trading decisions for stakeholders.
Trend Analysis
| Date | Closing Price | Trend Direction |
|---|---|---|
| 2025-12-12 | 195.63 | ▲ Uptrend |
| 2025-12-11 | 195.516 | ▲ Uptrend |
| 2025-12-10 | 194.926 | ▲ Uptrend |
| 2025-12-09 | 194.48 | ▲ Uptrend |
| 2025-12-08 | 193.151 | ▲ Uptrend |
| 2025-12-07 | 192.944 | ▲ Uptrend |
| 2025-12-05 | 192.947 | ▲ Uptrend |
The CHFJPY currency pair is currently in an uptrend, signifying potential positive movement. This is supported by a consistent period of the EMA20 being above the EMA50.
Support- and Resistance
| Zone Type | From | To |
|---|---|---|
| Support Zone 1 | 190.41 | 191.00 |
| Support Zone 2 | 187.23 | 188.00 |
| Resistance Zone 1 | 195.00 | 196.00 |
| Resistance Zone 2 | 198.00 | 199.00 |
Currently, the price is not within a strong support or resistance zone, which suggests room for either upward or downward movement devoid of immediate barriers. The positioning signals a potential for bullish continuation if the resistance levels are surpassed.
Conclusion
The recent analysis of CHFJPY indicates a persistent uptrend, backed by the moving averages crossing in a bullish manner, with the EMA20 trending above the EMA50. For traders, this suggests potential long opportunities should the current environment maintain its trajectory. However, vigilance is advisable around established resistance zones which may present cautionary signals. Analysts should remain alert for potential trend reversals should key resistance levels solidify as obstacles. Overall, the current technical landscape hints at promising upside potential, barring shifts in momentum or emergent market developments.